The last five years have seen a rapidly shifting landscape with inflated input costs and surging cattle prices. It can be easy to coast, allowing cost structures to rise to the level of cash coming into the operation. But now is the time to set yourself up for the next phase of the cattle cycle. High prices cure high prices; they won’t stick around forever. How are you investing in your business to be more competitive when prices turn? Are you a competitive supplier of weaned calves? Do you know if you are a high- or low-cost producer?
Individual benchmarking allows for incremental improvement from year to year. Comparison to a provincial average tells a producer if they are competitive in the marketplace. Comparison to similar management systems allows producers to identify ways they can improve their competitiveness. The Canadian Cow-Calf Cost of Production Network was designed to give producers benchmarks that represent a variety of production and management systems, showcasing incremental steps that can be taken to improve competitiveness. The aggregated results give an indication of what to aim for. It should be noted that benchmarks are not based on who is the most productive. Benchmarks are based on who is the most profitable. Benchmarks come from the top third, not the average.
What costs are you covering?
Read Also
Linking human evolution to leadership on the ranch
Simon Sinek’s new book explains why leaders need to foster a feeling of belonging, trust and co-operation in their organizations
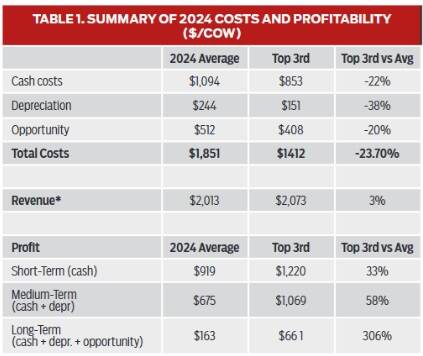
In 2024, with revenue (up 16 per cent) growing faster than total costs (up five per cent), profitability improved across Canada (Figure 1). All benchmark farms covered short-term (cash) costs, and a vast majority (95 per cent) managed to cover medium-term (cash and depreciation) costs (Table 1). Covering depreciation is critical to long-term survival of an operation as it ensures that assets can be replaced. As machinery and repair costs move higher, producers calculating depreciation based on book value can be caught off-guard as replacement costs move higher. About 59 per cent of farms were able to cover long-term costs, such as cash, depreciation and opportunity. Covering opportunity costs represents a return to land, labour and capital, giving producers the signal to expand the herd. In comparison, in 2023, 95 per cent of farms covered short-term costs, 91 per cent covered medium-term costs and about 50 per cent covered long-term costs.
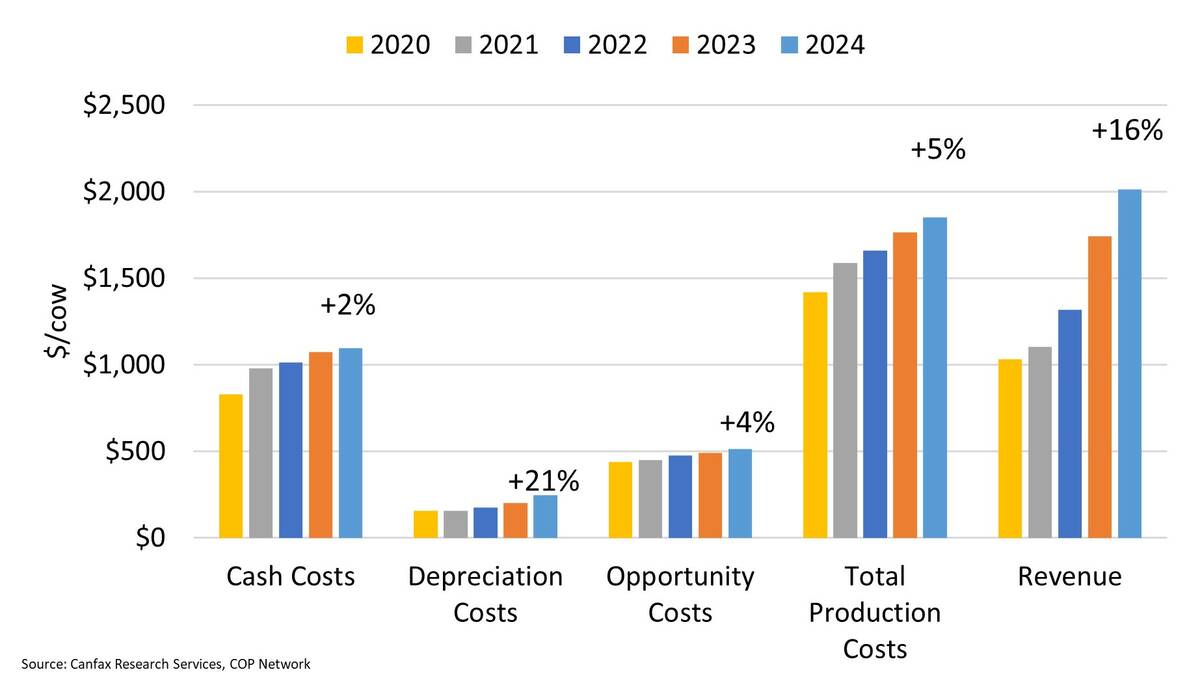
Overall, average short-term profits were up from $668/cow in 2023 to $919/cow in 2024, medium-term profits were up from $465/cow to $675/cow, and long-term profits were up from $25/cow to $163/cow. (Table 1). While these figures reflect a positive trend in profitability for 2024, there is significant variability between operations. The top third of benchmark farms had short-, medium- and long-term profits that were 33 per cent, 58 per cent and 306 per cent higher than the average. Some operations have experienced much higher profitability, while others saw less favourable results.
Profit drivers
The five per cent rule says that profits are driven by:
1. Marketing — output price (revenue)
2. Productivity — pounds produced/sold
3. Input costs — cash, depreciation and opportunity
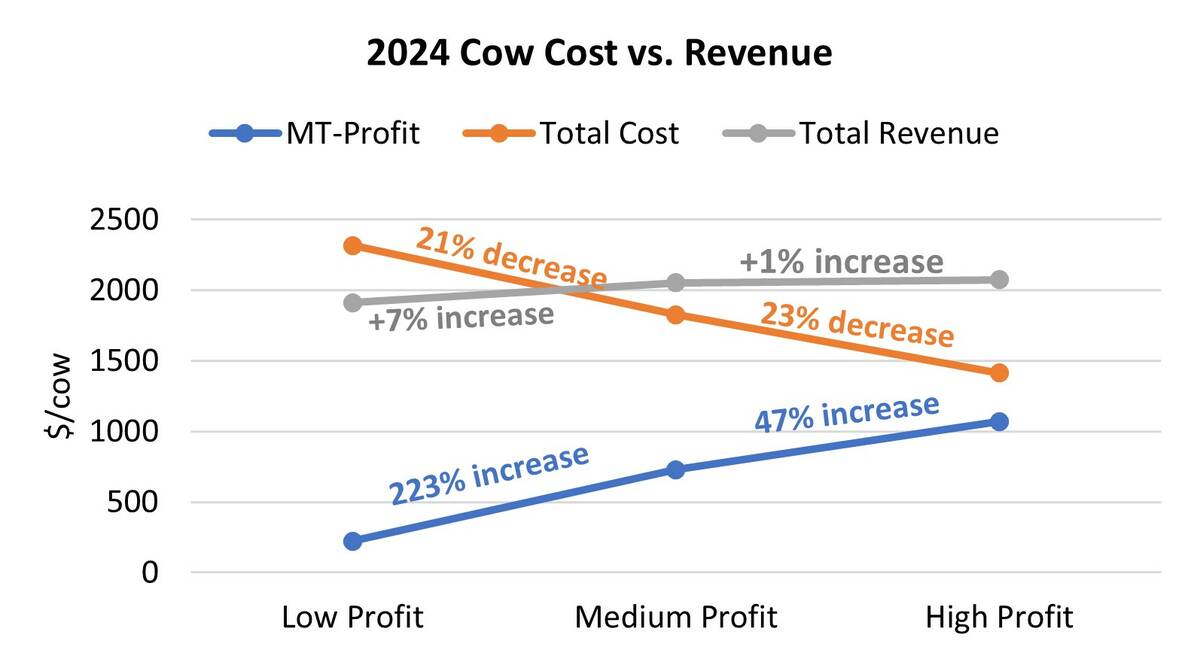
When the 64 benchmarks are divided into three equally sized groups based on medium-term profit (see Figure 2), it becomes clear that controlling costs is a major profit driver representing the key difference between the groups. Total costs dropped 21 per cent from the low- to medium-profit group and by another 23 per cent from the medium- to high-profit group, supporting a significant 223 per cent and 47 per cent increase in medium-term profit, respectively. Meanwhile, the total revenue for both groups had modest gains of seven per cent and one per cent, making a smaller contribution. This highlights the critical role that controlling costs plays in maximizing profits, which is something producers have more control over than output prices.
Controlling costs
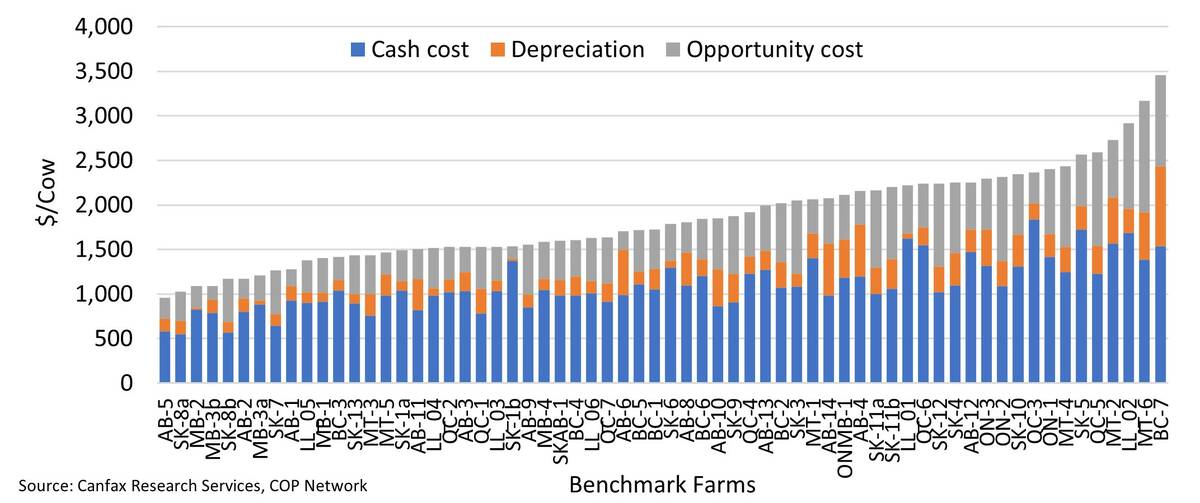
Overall, total production costs per cow have an upward sloping supply curve (Figure 3), with both low-cost and high-cost production systems represented.
In 2024, the average total cost (Table 1) rose to $1,850 per cow, up five per cent from 2023. The increase was more pronounced in the East, where costs increased from 2023 by seven per cent, compared to a four per cent increase in the West since 2023. The larger cost hike in the East is primarily due to inflationary pressures offsetting the effects of the 2023 drought in the West, as well as increased demand from western producers purchasing winter feed from the East in 2023.
Breaking down the total costs, 59 per cent ($1,094) were cash costs, 13 per cent ($244) depreciation and 28 per cent ($512) were opportunity costs. These are consistent with the previous year, which had 61 per cent cash costs, 11 per cent depreciation and 28 per cent opportunity costs.
Continuous improvement
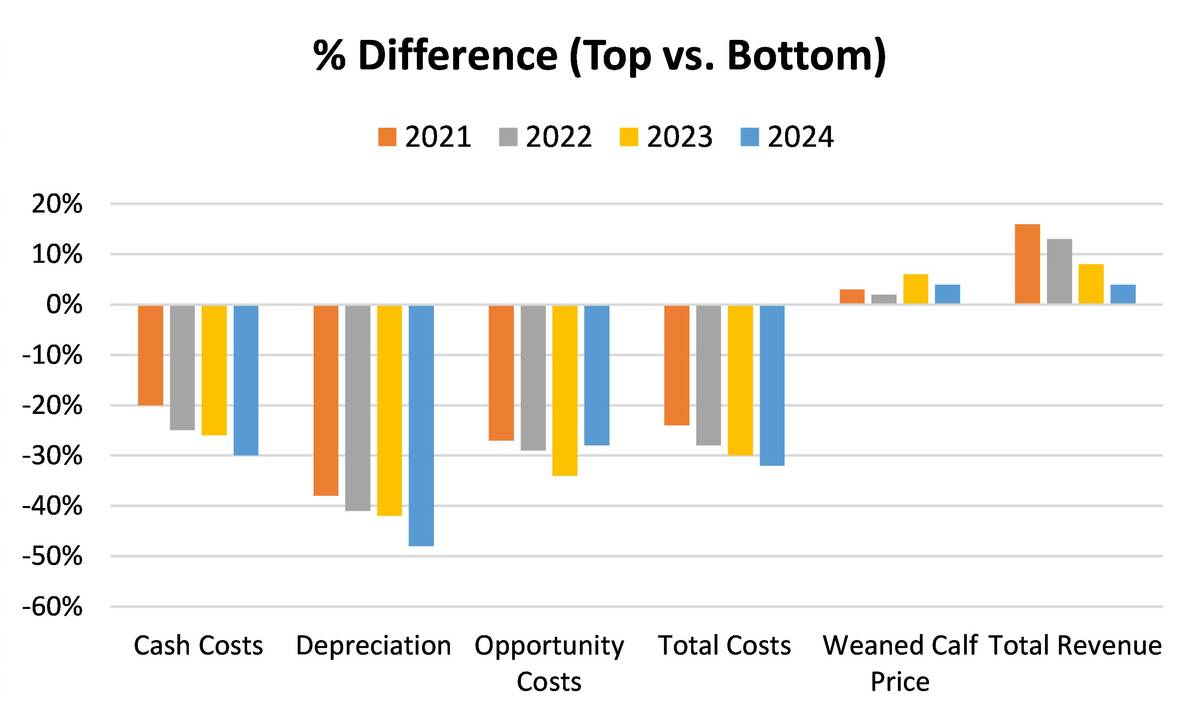
The difference, when comparing the costs for the top one-third of farms to the bottom two-thirds (Figure 4), has widened 10 percentage points from 2021 to 2023 — from 20-30 per cent for cash and 38-48 per cent for depreciation costs. This represents the top third making continuous improvements in their operations. This widening gap shows how those who are most competitive cement their position during profitable times. Total costs for top-performing farms are 24 per cent to 32 per cent lower than those of the bottom tier, driven by consistent double-digit reductions in cash costs, depreciation and opportunity costs across all years. It is worth noting that the top one-third group does not focus on just cash costs, but is controlling every aspect of their cost structure. In contrast, weaned calf prices show only modest variation between top and bottom farms, with differences ranging from two per cent to six per cent, underscoring the limited influence producers have over market prices. As cattle prices have increased in recent years, the total revenue gap has narrowed — from 16 per cent in 2021 to just four per cent in 2024 — suggesting that when prices are high, all cow-calf producers benefit. But when the price cycle turns, we should remember that these top-performing operations not only control costs but also received more revenue. It is never too late, nor too early to start working on developing reputation cattle.
Preparing for the next phase
At the top of the price cycle, producers have an opportunity to strategically set themselves up for the future. Reinvesting profits into operational improvements, genetic advancement, or resource efficiency can serve as a proactive hedge against the cyclical nature of the cattle market. While the shrinking cattle supply has shifted market leverage toward cow-calf producers, enhancing profit potential, it has simultaneously increased exposure to market volatility, with large price ranges. Cost control combined with building reputation cattle can buffer operations against price volatility and enhance resilience in subsequent phases of the cattle cycle. Thoughtful planning during this phase is essential to ensure sustainability and competitiveness as the industry transitions into the next cycle.
Canfax is funded by memberships. Go to www.canfax.ca to subscribe.
Disclaimer/Copyright Notice: Canfax Research Services (CRS) tries to provide quality information, but we make no claims, promises, or guarantees about the accuracy, completeness, or adequacy of the information. CRS does not guarantee and accepts no legal liability arising from or connected to, the accuracy, reliability, or completeness of any material contained in our publications. Reproduction and/or electronic transmission of this publication, in whole or in part, is strictly forbidden without written consent from CRS. c