Feed grain prices have been percolating higher this summer due to tighter supplies and increasing ethanol demand. Canadian barley production will be down sharply from 2009 due to lower seeded area. Industry sources estimate that barley acres could be the lowest in 30 years. Corn acres are expected to the second largest on record but growing export demand along with increased ethanol production will keep the 2010-11 carryout level historically low. The feed grain markets appear to be incorporating a risk premium due to the uncertainty in production. Extreme temperatures during corn pollination could result in extreme volatility later in summer.
Read Also
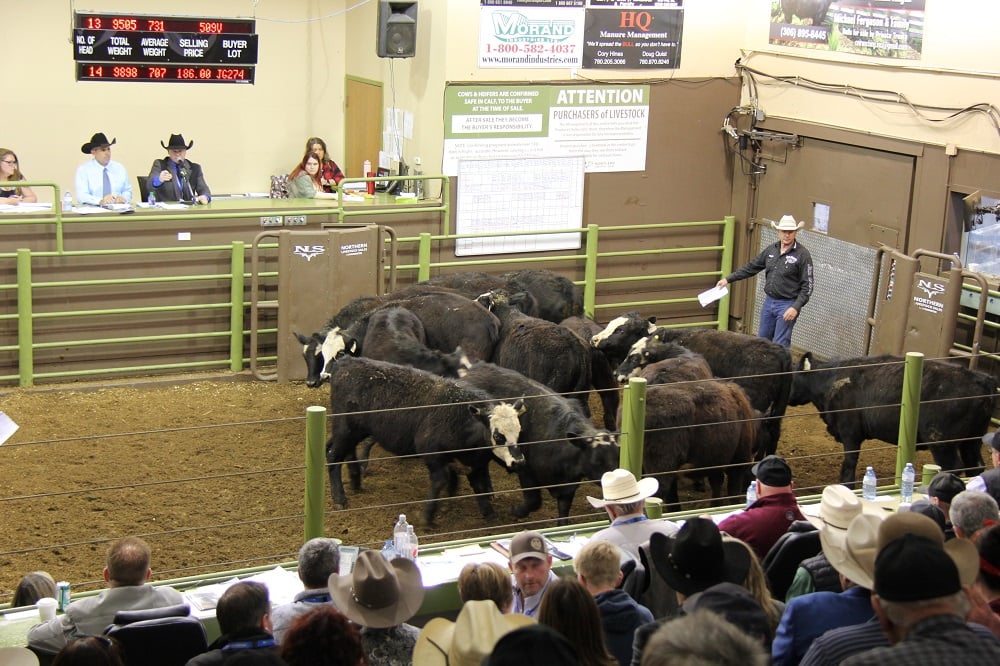
Cattle Market Summary
Break-evens, cow and calf prices, plus market summaries courtesy of Canfax and Beef Farmers of Ontario. Cost of Production September…
Statistics Canada reported barley acres at 8.051 million on their recent survey which was taken between May 25 and June 3. However, only 85 per cent of the barley was seeded due to extreme wet conditions and acreage is now estimated at 6.441 million. Using a normal abandonment rate and an average yield projection, production is expected to finish at 7.1 million mt, down from 9.5 million mt in 2009. Without going into detail, the 2010-11 barley carryout has potential to drop under 1.2 million mt. The barley available for domestic feed usage will be down nearly two million mt which will have to be made up with imports of DDGS and U. S. corn.
Imports of DDGS are expected to reach 1.2 million mt in the current crop year. During 2010/11, we could see DDGS imports total 1.8 million mt. The remaining feed demand in Western Canada will likely be filled with 1.5 million mt of U. S. corn imports. In a normal year, we may see 300,000 mt of U. S. corn move into Western Canada. When droughts plagued Western Canada in 2001-02 and 2002-03, imports of U. S. corn averaged 2.5 million mt so this is our reference point.
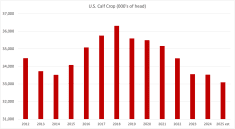
The USDA estimated U. S. corn acres at 87.9 million; while this number was above last year’s seeded area of 86.5 million, traders were expecting acres to come in near 89.3 million. Actual acreage was 1.4 million below analysts’ pre report estimates. Using a trend line yield, U. S. corn production is expected to come in near 13.2 billion bushels, slightly higher than 13.1 billion bushels in 2009. Corn demand appears to be increasing as ethanol usage will increase from 4.5 billion bushels in 2009-10, to 4.7 billion bushels this year. Exports are expected to stay strong in the upcoming crop year, resulting in a carryout of 1.4 billion bushels, down from 1.5 billion bushels in 2009-10. The fundamental structure is such that the market cannot afford to have a crop problem in the Midwest. Otherwise, the carryout will drop to historical low levels and stronger prices will occur.
The function of the barley market is to ration demand; therefore, we need to see barley trade at a $15 to $20 premium over delivered U. S. corn values into southern Alberta. Corn will have a larger influence on western Canadian feed grain prices this year.
Other major feed grain-producing countries are also facing adverse weather. Russia and Kazakhstan are enduring drier conditions during their growing season resulting in smaller feed wheat crops. Extreme heat is affecting crops in France, Spain, Germany and Poland, limiting their coarse grain and wheat production. Lower grain production is also expected in North Africa and the Middle East after last year’s bumper crops. We are not in a runaway bull market, which is very important to keep in mind, but world stocks are tightening for both coarse grains and wheat.
The world has a large carryover from 2009/10 which will limit the price strength on export markets. Despite the smaller crops, the Baltic Dry Freight Index, which measures the cost of ocean freight, is trending downward nearing historical lows from 2008. This reflects a sluggish demand scenario for bulk commodities in the short term. Generally speaking, world buyers are not stepping forward at these higher prices.
JerryKlassenisacommoditymarketanalystinWinnipegand maintainsaninterestinthefamilyfeedlotinsouthern Alberta.Hewritesanin-depthbiweeklycommentary calledCanadianFeedlotandCattleMarketAnalysis forcattleproducersinWesternCanada.Hecanbe reachedbyemailat [email protected] or204-287-8268for
questionsorcomments.
Thematerialcontainedhereinisforinformation purposesonlyandisnottobeconstruedasanoffer forthesaleorpurchaseofsecurities,optionsand/or futuresorfuturesoptionscontracts.Whiletheinformation inthispublicationcannotbeguaranteed,it wasobtainedfromsourcesbelievedtobereliable. Theriskoflossinfuturestradingcanbesubstantial. Thearticleisanopiniononlyandmaynotbeaccurate aboutmarketdirectioninthefuture.Donotuse thisinformationtomakebuyingorsellingdecision. Thisoutlookmaybewrongandcouldcauseadverse financialconsequencesifdecisionsarebasedonthis information.
———
U. S. corn supply and demand
Acres seeded
Acres harvested
Yield (bu./ac.)
SUPPLY (million bushels)
Opening stocks Aug. 1
Production
Imports
TOTAL SUPPLY
USE (million bushels)
Feed-waste-dockage
Feed/seed industrial
Ethanol
Domestic demand
Exports
TOTAL USE
TOTAL CARRYOVER
Source: USDA
04/05
80.9
73.6
160.4
958
11,807
11
12,776
6,158
2,686
1,323
8,844
1,818
10,662
2,114
05/06
81.8
75.1
148
2,114
11,114
9
13,267
6,155
2,981
1,603
9,136
2,134
11,270
1,967
06/07
78.3
70.6
149.1
1,967
10,535
12
12,514
5,598
3,488
2,117
9,086
2,125
11,210
1,304
07/08
93.6
86.5
151.1
1,304
13,074
18
14,396
5,999
4,338
3,000
10,337
2,435
12,772
1,624
08/09
86.0
78.6
153.9
1,624
12,092
14
13,729
5,246
4,953
3,677
10,198
1,858
12,056
1,673
09/10
86.5
79.6
164.7
1,673
13,110
10
14,793
5,525
5,840
4,500
11,365
1,950
13,315
1,478
10/11
87.9
81
163.5
1,478
13,244
10
14,732
5,350
6,060
4,700
11,410
1,950
13,360
1,372