MarketsFarm — Statistics Canada (StatCan) reported that 2022 had the smallest domestic canola crush for a calendar year since 2017. As well, 2022 marked the smallest canola oil production in five years and the least amount of canola meal produced in four years.
The sharp reduction of canola being crushed was due to the 2021 drought on the Canadian Prairies, with far less of the oilseed being harvested.
StatCan reported the 2022 crush came to 8.769 million tonnes, down 11 per cent from the previous year. Also, the amount of oil produced was nearly 3.652 million tonnes, falling 13.4 per cent from the year before. The amount of canola meal in 2022 was 5.222 million tonnes, slipping 8.4 per cent from a year ago.
Read Also
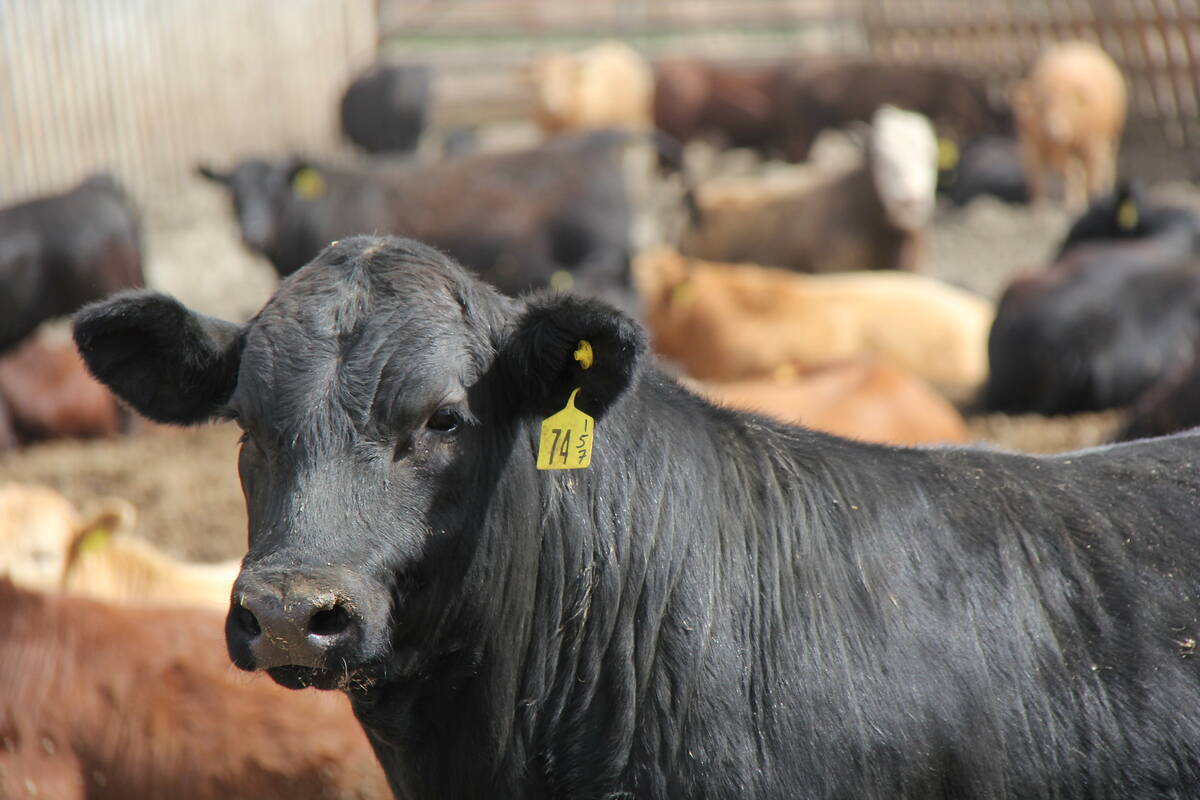
U.S. livestock: Feeder cattle hit record high on tight supply, strong cash prices
Chicago | Reuters – Chicago Mercantile Exchange feeder cattle futures scaled to a record high on Wednesday on strong cash…
However, that isn’t the same story for Canada’s soybean output, with 2022 besting the previous two years. StatCan said domestic processors crushed 1.869 million tonnes of soybeans, topping 2021 by 13.3 per cent. Soyoil produced came in at 349.216 tonnes, also up 13.3 per cent. The amount of meal was 1.453 million tonnes, for a 13.3 per cent improvement over 2021.
Soybean production was not as severely affected by the 2021 drought as more than 80 per cent of the crop is grown in Ontario and Quebec, which were largely drought-free that year. Less than 20 per cent of Canada’s soybeans are harvested on the Prairies, the vast majority in Manitoba. As for canola production, well in excess of 90 per cent of it is gleaned from the Prairies.
Table 1. Calendar year canola crush, in millions of tonnes.
| Year. . | Crush. . | Oil. . | Meal |
| 2017 | 9.179 | 4.046 | 5.118 |
| 2018 | 9.286 | 4.118 | 5.172 |
| 2019 | 9.609 | 4.187 | 5.381 |
| 2020 | 10.290 | 4.495 | 5.786 |
| 2021 | 9.857 | 4.218 | 5.700 |
| 2022 | 8.769 | 3.652 | 5.222 |
Table 2. Calendar year soybean crush, in millions of tonnes.
| Year. . | Crush. . | Oil. . | Meal |
| 2017 | 1.825 | 0.341 | 1.413 |
| 2018 | 2.059 | 0.382 | 1.595 |
| 2019 | 1.906 | 0.360 | 1.478 |
| 2020 | 1.757 | 0.319 | 1.364 |
| 2021 | 1.649 | 0.308 | 1.283 |
| 2022 | 1.869 | 0.349 | 1.453 |
Source: Statistics Canada, crushing statistics of major oilseeds.