CNS Canada –– The lateness of this year’s harvest will likely leave more questions than answers when Statistics Canada releases its final production estimates of the year Tuesday, as a significant portion of the crop was likely still on the fields when the survey was conducted.
Model-based estimates released in September placed the canola crop at 18.3 million tonnes — well above the August survey estimate of 17 million tonnes, but in line with the 2015-16 crop of 18.4 million.
However, poor conditions in Alberta and Saskatchewan for much of October meant that many acres weren’t harvested until November.
Read Also
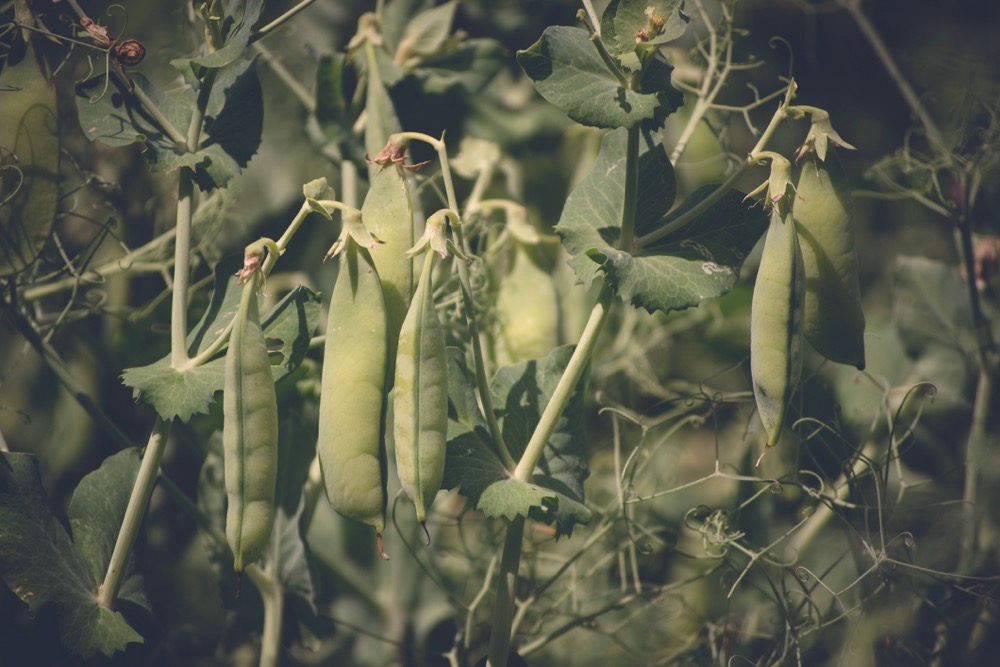
Pulse Weekly: Yields coming into focus
Provincial agricultural departments are reporting pulse yields higher than Statistics Canada’s September estimates.
“We’ll see if (the Dec. 6 report) confirms the first estimate was too low,” said Ken Ball of PI Financial in Winnipeg. He noted yields were surprisingly large in the late-harvested crops, according to anecdotal reports. However, even with the good harvest window in November, some fields will still be left to overwinter.
With those questions of unharvested acres and actual yields still circulating, trade estimates on the size of the crop range anywhere from 16.9 million to 20 million tonnes.
“Whatever number comes out, it will be discounted,” said Wayne Palmer of AgriTrend Marketing in Winnipeg. “We took a lot of canola off in November, and the survey was done before that.”
Looking at the other crops, most industry participants are only anticipating minor changes from the earlier forecasts, with the same uncertainty over how the late harvest will factor into the StatsCan calculations encouraging a healthy sense of caution ahead of the report.
— Phil Franz-Warkentin writes for Commodity News Service Canada, a Winnipeg company specializing in grain and commodity market reporting. Follow him at @philfw on Twitter.
Table: Statistics Canada production summaries, in thousands of tonnes.
| Model-based. . |
Survey-based. . |
Final | |
| estimates, | estimates, | estimates, | |
| September | August | 2015-16 | |
| 2016-17 | 2016-17 | ||
| All wheat | 31,321.3 | 30,486.7 | 27,594.1 |
| -Durum wheat | 7,311.5 | 6,806.6 | 5,388.7 |
| -Spring wheat | 20,552.8 | 20,246.5 | 19,962.3 |
| -Winter wheat. . | 3,457.0 | 3,433.6 | 2,243.1 |
| Oats | 2,873.9 | 3,018.1 | 3,427.7 |
| Barley | 8,401.8 | 8,704.3 | 8,225.7 |
| Flaxseed | 576.4 | 575.8 | 942.3 |
| Canola | 18,309.3 | 17,023.8 | 18,376.5 |
| Dry peas | 4,607.8 | 4,611.1 | 3,200.7 |
| Lentils | 2,830.5 | 3,233.8 | 2,540.5 |