The Canadian cattle herd contracted in 2018, but feeder imports supported domestic beef production. Strong demand, especially from the global market, kept beef and cattle prices firm despite increased production. Prices have been holding at levels steady to slightly stronger than last year in the first quarter of 2019, but larger on-feed inventories and high feed prices add some caution to the market going forward.
Uncertainties around Chinese pork supply and demand may cause volatile prices throughout the year, as the North American market responds with both larger pork exports and potentially more volumes of alternative proteins. Although much of that is unknown at the moment, the futures market is already responding.
Read Also

What to know before you go to Agribition 2025
If you’re attending Agribition 2025, this is the place to find out about tickets, dates and what’s happening this year.
Cattle inventories
Canadian herd contracted in 2018
The Statistics Canada January 1 inventory report showed total cattle and calves down 1.1 per cent or 125,000 head at 11.45 million head. This is the lowest since 1991. Calves (<1 year old) were down 47,800 head, steers (greater than one year old) down 41,000 head and beef cows down 38,800 head or one per cent to 3.66 million head, again the lowest since 1991.
Beef cows were up 1.8 per cent in B.C. and 1.3 per cent in Saskatchewan. All other provinces reported a drop in beef cows. Beef cows were down 6.6 per cent in Manitoba (completely removing the increase reported last year), followed by 2.9 per cent in Quebec, 1.4 per cent in Alberta, 0.7 per cent in the Atlantic provinces and 0.5 per cent in Ontario. Over the last decade Eastern Canada has represented around 12 per cent of total beef cow inventories. Beef replacement heifers were also down 1.4 per cent to 553,800 head, with heifers down 2.6 per cent in the East and 1.2 per cent in the West.
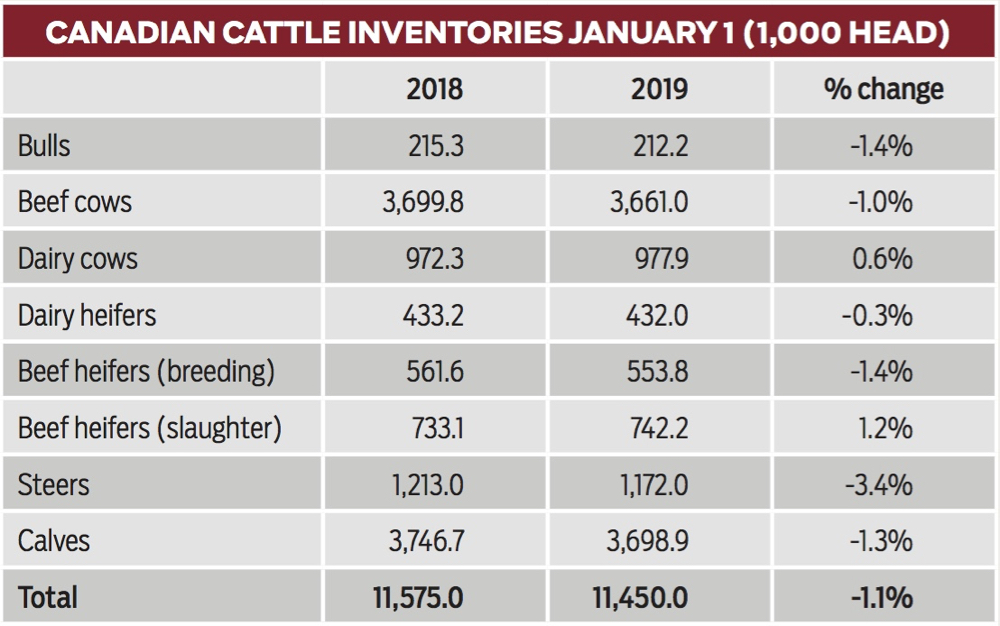
The calf crop was down 1.3 per cent, steers were down 3.4 per cent and slaughter heifers were up 1.2 per cent. The smaller number of feeder cattle combined with the larger numbers currently in feedlots resulted in the number of beef feeders outside of feedlots being down 1.6 per cent at 3.66 million head, the smallest on record (series started in 2000). While the calf crop has been declining, slaughter rates have been supported by reduced feeder cattle exports to the U.S. and over the last two years feeder imports. In addition, the proportion of fed cattle and cull cows processed in Canada has been increasing. What happens to inventories in 2019 is largely dependent on weather and winter feed production this summer. Improved moisture conditions are needed in several areas to reduce culling rates from the liquidation levels seen in 2018.
Looking forward to 2019, weather will continue to be a key factor in herd expansion, particularly in regions that were dry over the last two years. Alberta hay prices made a new record high at $142/ton, up 22 per cent from 2017 and the five-year average.
U.S. herd expansion slows but still growing
The USDA January 1 inventory report showed that for the fifth year in a row cattle numbers increased. However, it was the smallest rate of growth in the last five years as expansion is slowing. Total cattle numbers increased 0.5 per cent down from the fastest growth rate of 3.1 per cent seen between January 1, 2015 and January 1, 2016. The total U.S. cattle and beef cow inventories are now at their highest levels since 2008. This report was mostly in line with pre-report estimates, but it did show a slightly larger beef breeding herd than expected.

Beef cow inventories were up one per cent to 31.7 million head and are now 2.7 million higher than the 2014 low. USDA did adjust the January 1, 2018 beef cow inventory down 256,800 head, which offsets some of the year-over-year increase. Regionally, the south continues to grow faster as it was hardest hit by the drought earlier in the decade and continues to rebound. The two biggest beef cow states, Texas and Oklahoma, with 4.66 and 2.15 million beef cows, respectively, were up three per cent. The next three largest states are Missouri with 2.06 million cows (down one per cent), Nebraska with 1.94 million (up two per cent) while South Dakota with 1.82 million beef cows saw strong growth, up four per cent. Overall, regions from Texas through the Great Lakes are seeing expansion based on cheap feed. Meanwhile the southeast has remained steady despite hurricane issues and out west inventories are down with drought.
Although beef cow numbers continue to rise, heifer retention had its second year of significant declines. Beef heifer retention increased steadily from 2012 to 2017, but in 2018 breeding heifer inventories declined four per cent, and this year inventories were down another three per cent. Beef breeding heifer inventories fell below six million head for the first time since 2014.
The dairy herd is a major factor in the calf crop and overall beef production south of the border. Due to tough economic times in the dairy industry, dairy cow numbers were down about 0.8 per cent, while dairy replacement heifers were down 1.4 per cent as the sector was liquidating last year. Given the changes in cow inventories and the drop in the number of heifers expected to calve, the total 2019 calf crop is only expected to be slightly larger than last year.
The wet weather this winter has discouraged feedlot placements, with more cattle being put on winter wheat pasture and grazing. These conditions, combined with the larger inventory of feeders outside of feedlots, will likely lead to increased placements in the first half of 2019.
Prices holding
Cutout values
The AAA and AA cutouts averaged $269/cwt and $258/cwt, respectively, in 2018, up 0.7 per cent and 1.7 per cent from the prior year. This is back to 2016 levels and is the second year of relatively steady values. Seasonally, the 2018 third-quarter low was stronger than the three-year average. Prices were supported by strong exports with the wholesale beef demand index projected to be up 1.7 per cent, indicating strong foodservice interest. In the fourth quarter, the cutout was supported by a strong performance in the rib primal.
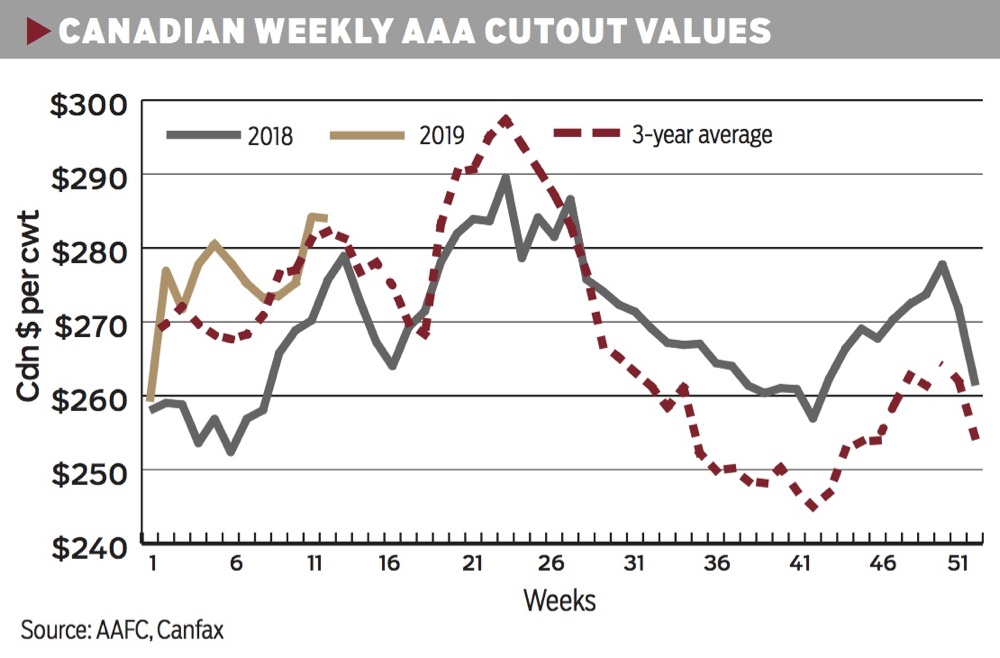
In the first half of March 2019, the AAA cutout was up four per cent from last year and was steady with the five-year average, with continued strong demand. The loin primal has picked up and was trading six per cent higher than last year. The AAA cutout is typically soft in late April with interest in competing meats for the Easter holiday before making a spring peak around the May long weekend.
The U.S. Choice cutout has been performing very well this spring. Despite winter conditions, the February 2019 Choice cutout averaged C$288/cwt, up seven per cent from last year. The AAA/Choice spread weakened to $20/cwt in mid-March, compared to -$14/cwt in 2018. The North American cutout has been supported this spring by stronger rib (+10 per cent) and loin (+4.0 per cent) prices.
Fed cattle
The Alberta fed cattle prices revisited last fall’s low of $148/cwt in February before rallying to $156/cwt in March 2019. This is four per cent below last year. Ontario fed cattle prices rallied 16 per cent from $125/cwt in December 2018 to $145/cwt in February 2019 before dropping back to $132/cwt in March, which is 11 per cent below last year. The Alberta-Ontario price spread narrowed to $4.80/cwt in February 2019 before widening back to $24/cwt in March as the two markets have been moving in opposite directions in the first quarter of the year. Prices are expected to be volatile throughout 2019 as information becomes available on how big of an impact African swine fever has had on the Chinese market.

After four years of a steadily stronger basis, the Alberta market has weakened against the U.S. market over the last year. The Alberta/Nebraska cash-to-cash basis averaged -$17.55/cwt in February and -$14.45/cwt in March. This compares to year-ago levels at +$3/cwt to +$1/cwt, and the five-year average at -$8/cwt to -$10.50/cwt, respectively. The shift in regional price spreads has been driven by regional supply and demand dynamics, as the U.S. herd has expanded in different locations than where historical packing capacity is. These price spreads are designed to signal the market on where to move cattle. Over the last couple of years it has attracted cattle into Western Canada where there was both feedlot and packing capacity. As feedlot space has filled, the basis is shifting again.
Alberta and Saskatchewan cattle-on-feed inventories on March 1 totaled 984,145 head, up 10 per cent from last year to be the largest since 2010. Placements were up 13 per cent in the third quarter of 2018 with calves being pulled off pasture early. Placements then dropped to be down four per cent in the fourth quarter and are on track to be up in the first quarter of 2019. However, weights were down in the third quarter of last year and January and February of 2019. Therefore it may take longer before those animals come to market.

Ample fed cattle supplies could delay marketing, contributing to heavier carcass weights and beef supplies. So far in 2019, steer carcass weights are averaging 16 pounds heavier than a year ago at 925 pounds, while heifer carcass weights are averaging 18 pounds heavier at 853 pounds.
Feeder cattle
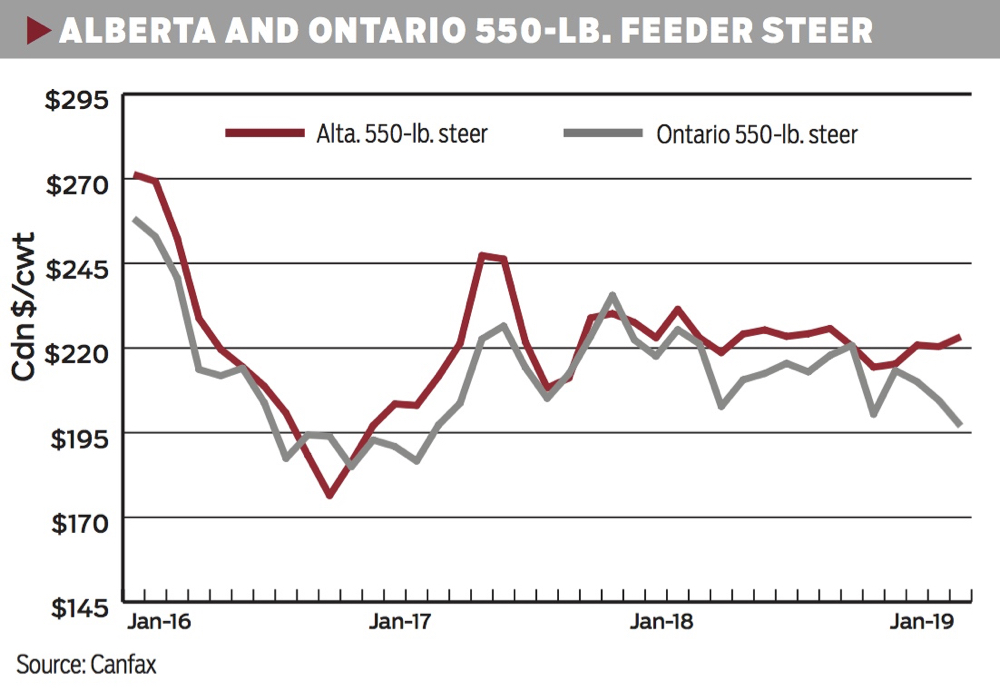
Alberta 500- to 600-pound steer prices have been relatively steady around $220/cwt since the fourth quarter of 2017. The monthly average in March was $223/cwt, steady with last year. Ontario 500- to 600-pound steer prices slid from $220/cwt in October 2018 to $197/cwt in March 2019, down 11 per cent or $24/cwt from last year. Ontario feeder prices have been pressured by lower fed cattle prices in the region.
Feeder cattle exports ended 2018 48 per cent higher at 194,000 head, while U.S. feeder imports were 197 per cent higher at 180,000 head, leaving Canada a net exporter to the tune of 14,000 head. The feeder basis has weakened from -$3.26/cwt in January to -$14.40/cwt in March but remains stronger than the five-year average (-$18/cwt). Feeder exports are 22 per cent higher through mid-March. Higher feeder exports are being influenced by tighter pen space and higher feed costs in Western Canada.
Lethbridge barley prices have surged 49 per cent from $164/tonne in March 2017 to $245/tonne in March 2018, and another 11 per cent to $272/tonne in March 2019, the highest since 2012-13. In comparison, corn prices have been relatively steady in Ontario and Nebraska ranging between C$180-204/tonne. Barley prices have put Alberta at a feeding disadvantage, with Ontario and Omaha corn prices being 28 per cent and 25 per cent lower, respectively. Consequently, corn imports into Western Canada were up 150 per cent in 2018 to 1.6 million tonnes. Corn imports into Eastern Canada were up 15 per cent to 358,500 tonnes.

Solid international demand
In 2018, Canadian beef exports were up five per cent in volume and 14 per cent in value to 398,580 tonnes (product weight) valued at $2.75 billion. Larger Canadian beef production and solid international demand supported volumes. The top five markets are made up of the U.S. (74 per cent), Japan (eight per cent), China, Hong Kong and Macau (7.7 per cent), Mexico (four per cent), and Southeast Asia (1.8 per cent). South Korea comes in sixth (1.1 per cent).
Exports to Japan at 32,110 tonnes valued at $214 million were up 20 per cent in volume and 33 per cent in value. The Comprehensive and Progressive Agreement for Trans-Pacific Partnership (CPTPP) came into effect on December 30, 2018. The first scheduled tariff cut on December 30 reduced the Japanese beef tariff of 38.5 per cent to 27.5 per cent on Canadian fresh beef and to 26.9 per cent on frozen beef. Japanese import statistics for January 2019 show volumes from Canada at 3,545 tonnes, more than triple the December 2018 volume of 1,282 tonnes and the January 2018 volume of 1,007 tonnes. The January 2019 volume is 57.6 per cent higher than the monthly average for 2018.
In January 2019, beef exports continued to be strong with volumes up 22 per cent and values up 46 per cent from January 2018. Big jumps were seen with Japan up 75 per cent in volume and 100 per cent in value, the U.S. up 16 per cent in volume and 35 per cent in value, China and Hong Kong up 120 per cent in volume and 182 per cent in value, and South Korea up 62 per cent in volume and 148 per cent in value from a small base.
On April 1, 2019, Canada will have a second tariff reduction in Japan to 26.6 per cent on both fresh and frozen beef, with additional cuts eventually reducing the tariff to nine per cent by 2033. Before CPTPP, Japanese importers were careful to ensure purchases did not to exceed the safeguard levels which would trigger the tariff to increase to 50 per cent. Countries that are a part of the CPTPP are exempt from that higher tariff level on frozen beef.
Uncertainties around Chinese pork supply and demand may cause volatile prices throughout the year, as the North American market responds with both larger pork exports and potentially more volumes of alternative proteins. Although much of that is unknown at the moment, the futures market is already responding.
Replacement ratios
The lower the replacement ratio the fewer dollars the feedlot must pay to replace a fed animal with a feeder. Conversely, a higher ratio means the feedlot must pay more per pound to replace those animals. Consequently, a higher ratio has negative implications on feedlot profitability as more dollars are spent placing new cattle.
Replacement ratios peaked in the third quarter of 2018 and have trended lower since then. From the Q4 2018 to Q1 2019, the replacement ratios were down five to 12 per cent in the East, and zero to eight per cent in the West.
Replacement ratios for all categories were lower than year-ago levels in the fourth quarter of 2018 but were mixed in the first quarter of 2019 with eastern steers being down, but eastern heifers and all western ratios up.