
At the time of this writing, crude oil has plunged $40 per barrel, losing 37 per cent of its value, since prices turned down from $107.73 in June 2014.
This market’s steady decline may have come as a surprise to some followers of oil, but for those who study charting and technical analysis, they were first alerted to the impending downturn in June 2014.
The first tell-tale sign of a change in trend occurred on June 23, when a two-day reversal materialized on the daily NYMEX WTI crude oil futures charts. By week’s end, a two-week reversal appeared on the weekly nearby futures chart, followed by the development of a two-month reversal on the monthly nearby chart on July 31.
Read Also

Canadian trade data delayed by U.S. government shutdown
Canadian international trade data for September will be delayed indefinitely due to the ongoing partial shutdown of the United States government, Statistics Canada said Friday, Oct. 24.
The validity of a market signal is greatly enhanced when a reversal pattern appearing on a daily chart is closely followed by reversal patterns on the longer term charts. Identifying such patterns greatly enhances one’s ability to identify changes in trend, which is a real advantage for making informed marketing decisions.
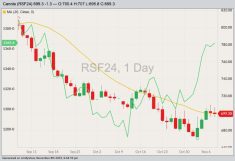
The probability of a valid trend turn is increased when a number of technically significant events occur at or near the same point in time. Shortly after the two-month reversal occurred, prices dropped below an important trendline, which caused the price of oil to plummet further. This is identified as point A in the accompanying chart.
Trendlines
During the course of a trend and all the fluctuations which compose it, there is a well observed characteristic for prices to closely follow a sloping straight line path. During a period of rising prices, this path is determined by a line drawn across the lows of the reactions. When an emerging trend can be identified and followed to its conclusion, it translates into opportunity. The use of trendlines is a valuable tool for accomplishing this.
In a rising market, for a trendline to be both valid and reliable there should be at least three points of price contact, each of which coincides with the low of a market reaction. These price reactions must bottom at progressively higher levels. Beyond the minimum of three contact points, the more times prices bounce off a trendline in a bull market, the more valuable it becomes as a trend indicator. Similarly, the longer the trendline continues without being breached, the greater becomes its technical significance.
Once a trend begins in earnest, it has a very high tendency to persist. Thus, a properly constructed trendline may be touched several times by the fluctuating market during the course of big move without being broken. The longer the trendline lasts, the more significant becomes its eventual penetration (A), as an indicator of trend change.
Therefore, it is important for farmers to keep an eye on the outside markets such as energy, metals and currencies, as these markets can and do influence the price of grain.
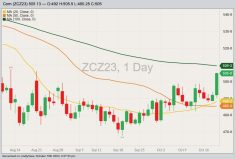
For example, a weak crude oil market can decrease the profitability of the ethanol and biodiesel industries and when this happens, it limits the upside potential of corn and soybean values. In turn, this weakness has the ripple effect of weighing on like crops such as feed grain and canola.
Canada, being a country rich in resources, is especially impacted by the price of oil. Falling oil prices not only weigh on the TSX and slow the economy, especially in Alberta, but also weaken the Canadian dollar. This list is not all-inclusive, but intended to demonstrate how closely tied the energy sector is to so many aspects of our day to day lives.
Therefore, it’s imperative to watch the outside markets, or you could find them sneaking up on you.
Send us your questions or comments about this article and chart.
— David Drozd is president and senior market analyst for Winnipeg-based Ag-Chieve Corp. The opinions expressed are those of the writer and are solely intended to assist readers with a better understanding of technical analysis. Visit Ag-Chieve online for information about our grain marketing advisory service and to see our latest grain market analysis. You can call us toll free at 1-888-274-3138 for a free consultation.