What a difference a year makes! In December 2009 feeder cattle prices were down challenging an area of support at $90. Prices quickly bounced off the line of support, as illustrated in the accompanying chart, and by the end of December a two-month reversal materialized, which indicated prices were about to turn back up. In the next 12 months leading up to December 2010, prices rallied to a new historical high of $122.
Two-month reversal
A two-month reversal indicates a change in trend. On the first month, the market declines and closes lower for the month. The following month, prices open unchanged to slightly lower, but fail to make additional downside progress. Prices begin to turn back up as buying increases early in the month. By the end of the month, the market rallies above the preceding month’s high and closes near that level.
Read Also

Southern California honeybees show resistance to varroa mites
Regionally-adapted honeybees in southern California show natural resistance to varroa mites, according to new research from University of California Riverside.
Market psychology: The two-month reversal signifies a turn in sentiment. In the first month, the shorts are quite content. The market’s performance provides encouragement and reinforces the expectation of greater profits.
The second month’s activity is psychologically damaging. It is a complete turnaround from the preceding month and shakes the confidence of those who are short the market. Shorts respond to strengthening prices by buying in order to exit the market.
I can still remember May 20, 2003 as if it were yesterday. This was the day a domestic case of BSE was confirmed in Canada and the feeder cattle futures market closed down the allowable daily limit.
I thought, “Why is this market limit-down? It should be limit-up because the closure of the border to Canadian cattle destined for the United States limited the supply of cattle south of the border.”
The very next day, sanity prevailed and the feeder cattle market turned back up. Within three months prices rallied to a new historical high above $90 to establish a new higher trading range. What had been resistance at $90 throughout the 1990s now proved to be support in the new millennium.
Since then, prices have been contained in a $30 range, with resistance up at $120 and support down at $90.
Support and resistance
Support and resistance are terms to describe a price level where the buying or selling of futures contracts is expected to noticeably increase and at least temporarily halt the current direction of the market. On bar charts these areas appear as well defined price ranges within which the market trades sideways before making a decisive move up or down. The greater the amount of time spent and the number of contracts bought and sold in this range, the greater will be the ensuing move when prices break out.
Support and resistance areas evolve because equilibrium is reached between buyers and sellers. Trading in a horizontal congestion area, the market attracts buying around the bottom of the range and selling in the top portion. If the congestion range is resolved by an upside breakout, a pullback to this area will encounter increased buying from longs wishing to add to profitable positions acquired near the bottom of the trading range as well as from shorts who having sold in the upper portion of the range are seeking to cut their losses.
In the short term, feeder cattle prices could be vulnerable to a downward correction to alleviate the overbought conditions. Longer-term, prices will need to have follow-through strength above $122 to confirm a decisive breakout to the upside.
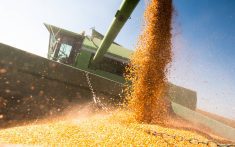
Once this occurs, look for feeder cattle prices to move higher in relationship to the strong corn market. This in turn will ultimately lead live cattle and lean hog prices up to new historical highs too.
Join me online for an audio-visual presentation about this article and chart.
— David Drozd is president and senior market analyst for Winnipeg-based Ag-Chieve Corp. The opinions expressed are those of the writer and are solely intended to assist readers with a better understanding of technical analysis. Visit us online for more grain marketing ideas and educational tools, or call us toll-free at 888-274-3138 for a free consultation.