Expected Progeny Differences (EPDs) predict the average performance of an animal’s future progeny for a specific trait, compared to other individuals’ progeny within the breed. They predict average group performance, rather than foretelling individual performance.
“If you have a bull with a weaning weight EPD of +50 and another one with a weaning weight EPD of +60, the difference is 10 pounds, and that’s the average difference you would see in their calves if you bred them to the same cow herd and gave the calves the same environmental opportunity,” says Kajal Devani, Canadian Angus Association’s director of science and technology.
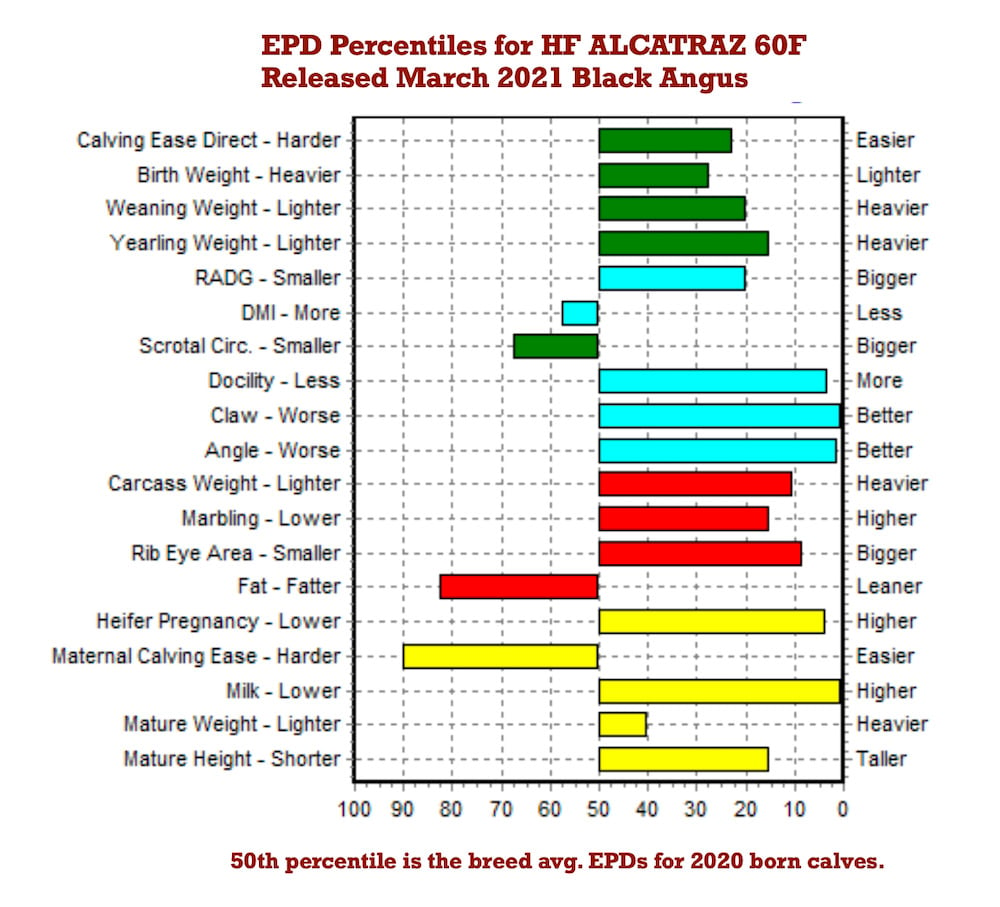
To calculate an individual’s EPDs, pedigree information, performance data and genomic information are compared to that of other animals within the breed. Genetic evaluations are run monthly to calculate current EPDs through statistical formulas. Devani walked us through the EPDs (current to April 6) for HF Alcatraz 60F, the most-used Canadian-born Black Angus AI sire in 2020. The definitions used here are based on the Canadian Angus Association’s (CAA) genetic evaluation.
Read Also
Canadian Beef Check-Off Agency reports on investments and activities
The check-off agency’s work behind the scenes is what ensures cattle check-off dollars are invested wisely, accounted for transparently and deliver measurable value back to producers and importers.
Production EPDs
Calving ease direct: Predicts the percentage of unassisted births in first-calf heifers exposed to the bull in question. “The higher the EPD, the higher the probability that if you used this bull on some first-time heifers, his calves would come out without assistance,” says Devani.
For example, a bull with a calving ease direct EPD of +15, compared to a bull with an EPD of +5 would have a 10 per cent greater probability of his progeny being born without assistance.
Birth weight, weaning weight and yearling weight: The birth weight EPD predicts the average difference in pounds in the individual’s calves at birth. “For example, you have this bull that has a birth weight EPD of +1.1. The breed average is +2.1, so on average this bull will sire calves that are one pound less than breed average,” says Devani.
Similarly, the weaning weight EPD predicts the difference in weaning weight in the bull’s progeny. “This bull is a +58 for weaning weight EPD, and the breed average is +48, so on average his calves will be 10 pounds heavier at weaning time than average Angus,” she says.
Yearling weight predicts the average difference in yearling weight of the bull’s progeny. With this bull’s +106 EPD, “you’re looking at 20 pounds heavier calves at yearling,” she says.
Residual average daily gain: Devani is a fan of this feed efficiency trait, introduced by the CAA in 2020. It predicts how much a bull’s weaned progeny will gain per day compared to another group of calves on the same amount of feed. A higher EPD denotes more pounds per day on average.
“If you were feeding 100 calves from Alcatraz and 100 calves from a bull whose residual average daily gain EPD was 0, then that would be 0.26 pounds per day extra on 100 head,” she says.
Dry matter intake: Measured in pounds per day, the dry matter intake EPD predicts the difference in feed intake potential of the sire’s weaned calves. Because this EPD solely predicts appetite, Devani recommends using it in conjunction with weaning or yearling weight. “I like (residual average daily gain) much better because it does that for you — it combines intake with growth.”
Scrotal circumference: Predicts the average difference in scrotal circumference in the individual’s bull calves, measured in centimetres. A higher number suggests a larger circumference. For example, compared to the bull calves of a sire with an EPD of +0.2, the bull calves of a sire with an EPD of +1.2 will have a scrotal circumference that is 1 centimetre larger, on average.
Docility: Predicts the average chute-side temperament of the bull’s progeny as yearlings, with a higher number suggesting a greater likelihood of docile cattle.
Claw set and foot angle: The claw set EPD predicts the likelihood of calves having what’s considered a more functional claw set, while the foot angle EPD predicts the likelihood of calves being closer to what’s considered the ideal foot angle. These EPDs relate to claw-set score and foot-angle score.
“The lower the number, the closer to five they get, which is that ideal score,” says Devani. This bull’s claw set and foot angle EPDs are both in the very top percentile for the breed average.

Maternal EPDs
Heifer pregnancy: Predicts the likelihood of a sire’s first-calf heifers becoming pregnant on first exposure, with a higher EPD suggesting conception is more likely. This bull’s EPD is +14, compared to the breed average of +10, so his daughters have a four per cent greater chance of catching upon first exposure.
Calving ease maternal: While calving ease direct is all about the calf, calving ease maternal EPD predicts how likely a bull’s first-calf heifers are to calve without assistance, with a higher EPD suggesting a higher likelihood of calving unassisted.
“It’s not about his direct calf coming out of a first-time heifer, it’s about how his daughters will do as a first-time heifer: her stamina, her pelvic shape, how well she responds to calving, and then her size and shape,” Devani explains.
Milk: Predicts both milking ability and the cow’s maternal ability, expressed in pounds. “A cow will contribute to her calf’s weaning weight in terms of additive growth genetics, but she also contributes to his weaning weight in terms of maternal environment,” she says. Compared to the breed average of +22, this bull’s EPD of +38 means his daughters will add an average of 16 pounds more to their calves’ weaning weights.
Mature weight and mature height: Mature weight EPD predicts the difference in mature weight of a bull’s female progeny, measured in pounds. Similarly, mature height EPD predicts their mature height, with the value expressed in inches.
Carcass EPDs
Carcass weight: Predicts in pounds the average difference in the hot carcass weight of a sire’s finished calves. In this bull’s case, an EPD of +50 means a higher probability of heavier carcass weight than the breed average, placing him in the top 10 percentile for the breed.
Marbling, ribeye area and fat thickness: The marbling EPD predicts the marbling potential of a bull’s finished calves. It is measured by the difference in grade score, and “the higher the number, the higher the marbling score,” says Devani.
The ribeye area EPD predicts the average difference in ribeye area of a bull’s finished calves, measured in square inches, with a higher number predicting a larger ribeye area.
The fat thickness EPD predicts the average difference in backfat thickness, measured in inches at the 12th rib.
Breed averages: Knowing the breed averages for each EPD is key to understanding an animal’s individual EPDs. “EPDs are comparative numbers. If I look at an animal’s EPDs, say Alcatraz, and I see a +106 yearling weight EPD, that doesn’t really tell me anything,” says Devani. “I need to use the breed average or I need to compare him to another bull.” The CAA includes breed averages for both Black Angus and Red Angus on its EPD reports.
Accuracy: The EPD report includes an accuracy measure for each trait. These are expressed as percentages and illustrate how reliable an EPD can be considered compared to the true breeding value. The accuracies for this particular bull are quite high, Devani explains, because of his high number of progeny and because he has been genotyped.
“We do our best to be as accurate as possible with the information that we have, but obviously it really depends on how much information we have with which to calculate the EPD, so that’s why we include accuracy,” she says.
As more progeny data becomes available for an animal, EPDs with low accuracy have a greater likelihood of changing, compared to animals with high accuracy.