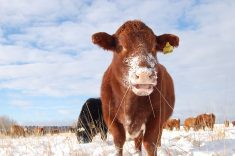
A large proportion of cow-calf producers’ total cost of production is associated with winter feed costs. In 2024, approximate feed costs (of purchased and homegrown feed) made up 63 per cent of cash costs and 37 per cent of total costs (cash, depreciation and opportunity costs). This is up from 56 per cent and 33 per cent, respectively, in 2020 as feed costs have driven cow-calf cost of production over the last five years. Typically, to be a competitive cow-calf producer you need to be a competitive producer of winter feed.
Within the Canadian Cow-Calf Cost of Production Network, on average only 11 per cent of feed is purchased, with 18 benchmark farms purchasing more than five per cent of their feed. These are typically in regions with surplus feed production. However, general farms with a higher proportion of purchased feed tend to have higher feed costs. Risks associated with a high reliance on purchased feed include cash flow in drought years, when feed costs surge. This makes the cost competitiveness of homegrown feed a key differentiator between profit and loss.
2024 benchmarks
Read Also
Alberta fed cattle prices forecast to reach $335-345 per cwt. in Q2 2026
Alberta fed cattle prices are forecast at $335-345 per cwt. in Q2 2026, covering variable feedlot costs but slightly below break-even.
When machinery cost and fuel are considered, the average approximate feed cost1 was $690 per cow in 2024, up five per cent from 2023. This was up three per cent or $20 per cow in Western Canada and up nine per cent or $64 per cow in Eastern Canada. Overall, 33 per cent of the benchmark farms have approximate feed costs below $600 per cow, with the top third most profitable benchmark farms averaging $559 per cow with 204 days on feed and daily feed costs of $2.76 per head per day. While days on feed were not much different between the average and top third, the daily feed cost was 26 per cent lower, contributing to the 19 per cent lower cost for the entire winter.
| Metric | Range | Avg | Top third | Top v Avg |
| Daily feed costs ($/hd/day) | 2.04-11.72 | 3.73 | 2.76 | -26% |
| Days on feed | 60-250 | 194 | 204 | +5% |
| Approximate feed costs ($/cow/year) | 368-1173 | 690 | 559 | -19% |
The daily feed cost is calculated by dividing approximate feed cost by the number of total winter-feeding days, based on the assumption that most of the costs for feeding and feed production are incurred during the winter feeding period for most benchmark farms, except for year-round grazing operations. Daily feed cost for year-round grazing operations is likely overestimated due to a short winter feeding period (60 days).
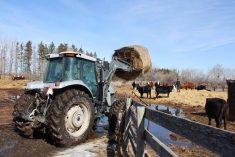
Winter feeding systems
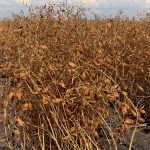
Benchmark farms were categorized by primary type of forage fed in the winter diet. These were:
- Annuals: including greenfeed, straw, swath graze, corn graze and crop residues
- Hay (perennial forages): including dry hay, haylage and baleage
- Silage (annual forages): including oat silage, barley silage, pea silage and corn silage
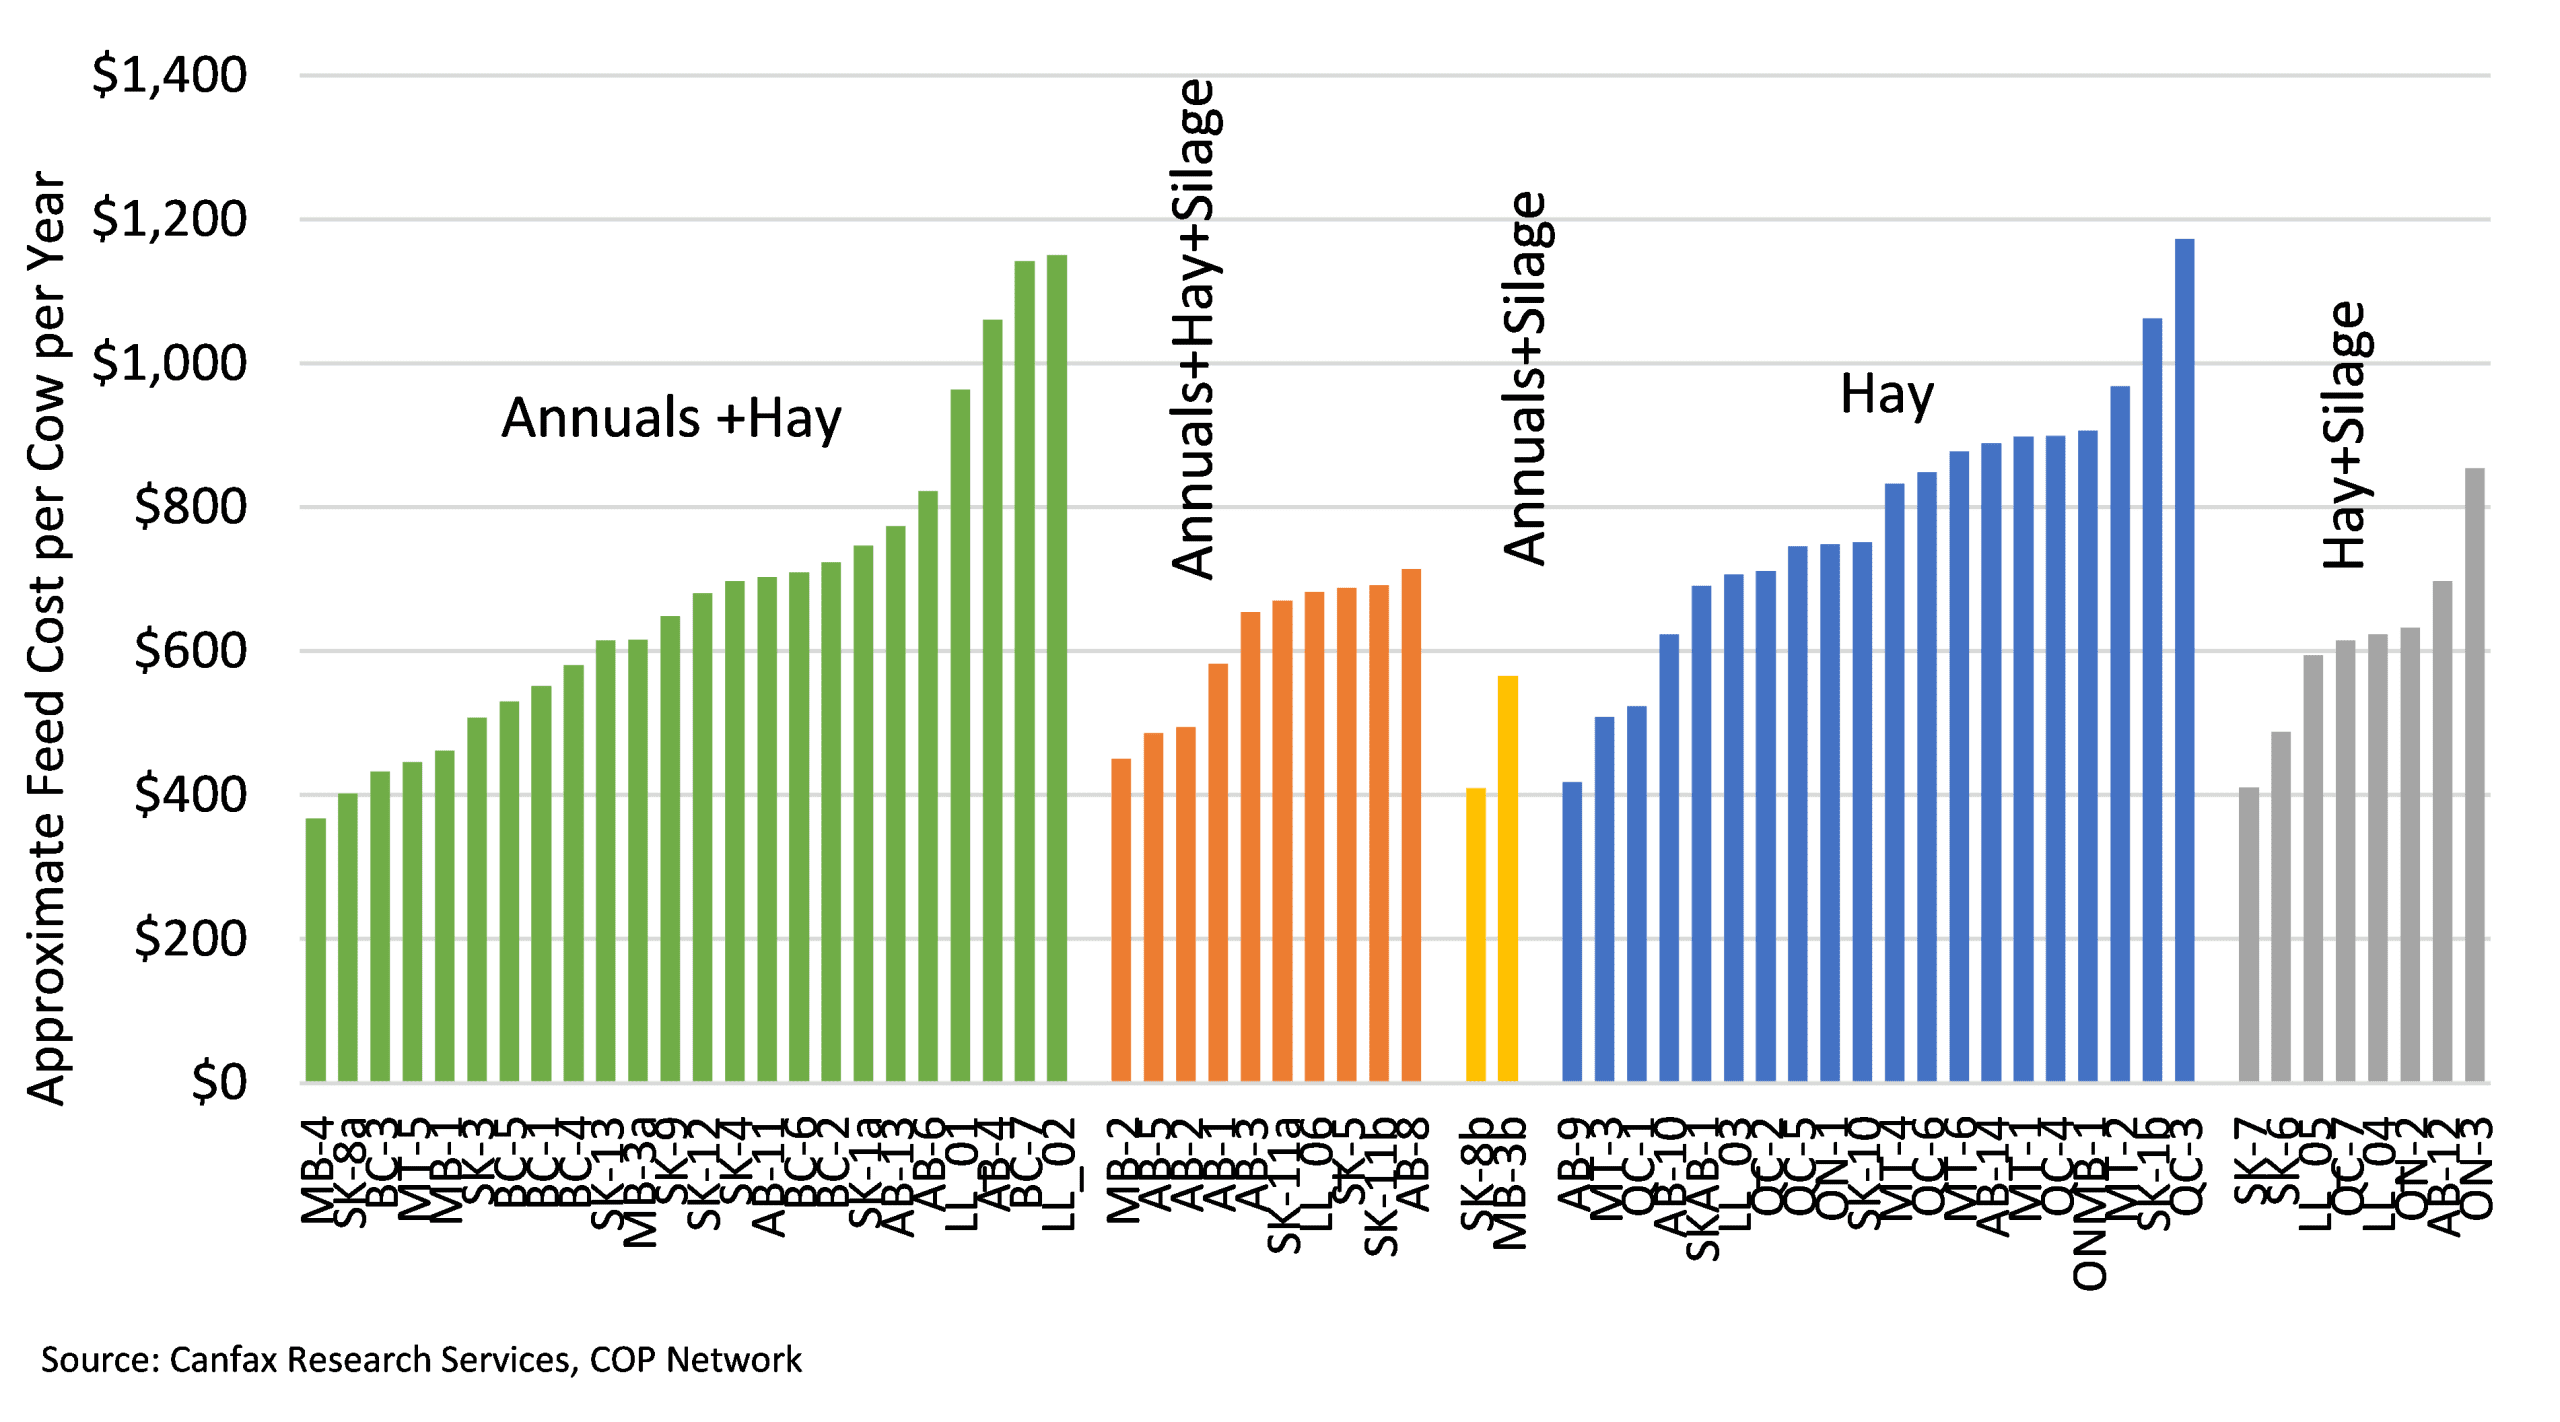
There is a wide range of costs observed across different feed types (Figure 1). Farms can be either high-cost or low-cost using any of the feedstuffs. This suggests that it is not the feedstuff itself that determines whether a farm is high- or low-cost, but rather how effectively the management and utilization is within the overall operation. Efficient management practices, rather than feed type alone, play a crucial role in controlling feed costs.
As input costs rise, it has raised questions about the relative competitiveness of different feedstuffs. Over the last five years, hay/silage has seen the largest increase in cost structure at 53 per cent, while annuals/silage has seen the smallest at 43 per cent and has maintained its position as the lowest cost on average.
2024 top third benchmark feed costs are:
- $559 per cow per year
- $2.76 per head per day
Approximation of feed cost is calculated as feed cost (purchase feed + fertilizer, seed and pesticides for feed production) + machinery cost (machinery maintenance + depreciation + contractor) + fuel, energy, lubricants and water (such as irrigation).
Cost-effective forage production
While relatively higher productive regions have a yield advantage that supports competitiveness it is possible for lower productive regions to be cost competitive.
- Forage yield per acre: Select species and varieties appropriate for your soil type, moisture conditions and growing season. Soil test to manage fertility and pH if needed. Cut at optimal maturity to balance yield and quality.
- Reduce harvest costs and losses: Minimize machinery passes. Optimize bale size and density to reduce labour, transport and storage costs.
- Reduce storage losses: Use net wrap or plastic wrap to reduce leaf loss. Store bales off the ground and cover to avoid weathering.
- Feed efficiency: Test forage quality to match cow nutritional requirements and avoid overfeeding protein or energy. Use lower-quality feed for dry cows, and save higher-quality for lactating cows and heifers. Reduce waste during feeding, providing only what is needed for 1-2 days.
| Approx Feed Costs ($/cow) | 2020 | 2021 | 2022 | 2023 | 2024 | 2024 vs. 2020 |
| Annuals/Hay | 453 | 601 | 605 | 653 | 681 | 50% |
| Annuals/Hay/Silage | 410 | 586 | 546 | 601 | 612 | 49% |
| Annuals/ Silage | 342 | 568 | 480 | 485 | 487 | 43% |
| Hay | 536 | 625 | 697 | 746 | 789 | 47% |
| Hay/Silage | 401 | 528 | 484 | 566 | 615 | 53% |
| Daily Feed Costs ($/hd/day) | 2020 | 2021 | 2022 | 2023 | 2024 | 2024 vs. 2020 |
| Annuals/Hay | 2.58 | 3.38 | 3.43 | 3.75 | 3.90 | 51% |
| Annuals/Hay/Silage | 2.14 | 3.04 | 2.84 | 3.11 | 3.17 | 48% |
| Annuals/ Silage | 1.71 | 2.84 | 2.40 | 2.43 | 2.44 | 43% |
| Hay | 2.82 | 3.32 | 3.70 | 3.99 | 4.19 | 49% |
| Hay/Silage | 2.00 | 2.67 | 2.42 | 2.82 | 3.06 | 53% |
Key takeaways
- You can be high- or low-cost with any feedstuff. Cost control is more about management than feed choice.
- Over the last five years, input cost inflation has had an impact on each feedstuff differently, with some increasing more or less than others.
- Controlling homegrown forage production costs is key to being a competitive cow-calf producer. c
What is the COP Network?
The Canadian Cow-Calf Cost of Production Network (COP Network) uses standardized data collection, which allows for comparison both within and between provinces, and internationally. Since launching in 2021, the COP Network has collected data from more than 235 producers contributing to 64 cow-calf benchmark farms that represent various management systems. Each benchmark is based on data from three to seven producers. Data collection occurs every five years with annual indexing of input and output
prices, as well as crop and forage yields, in subsequent years. Individual benchmark farm summaries can be found here.
Canfax is funded by memberships. Subscribe here.
Disclaimer/Copyright Notice: Canfax Research Services tries to provide quality information, but we make no claims, promises or guarantees about the accuracy, completeness or adequacy of the information. Canfax Research Services does not guarantee and accepts no legal liability arising from or connected to, the accuracy, reliability or completeness of any material contained in our publications. Reproduction and/or electronic transmission of this publication, in whole or in part, is strictly forbidden without written consent from Canfax Research Services.