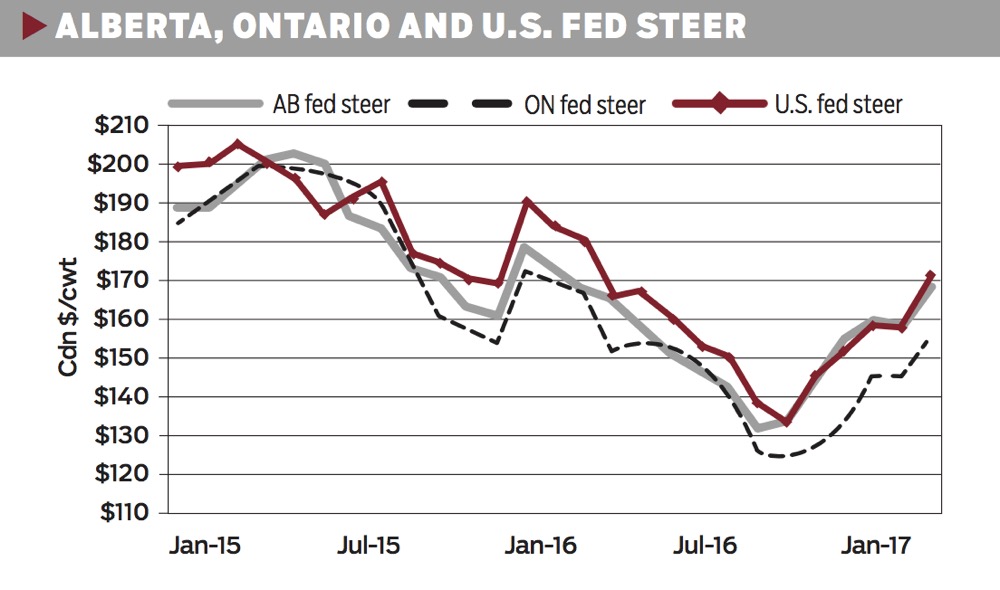
Growth in domestic beef production has been tempered by smaller carcass weights offsetting larger slaughter numbers. Smaller production gains combined with strong export markets have resulted in unexpected strength in the fed cattle market that rallied 28 per cent from the October low to March. Alberta fed cattle prices in March were steady with last year and have performed better than the U.S. or Ontario markets.
Canadian beef cow inventories stable
The January 1, 2017 total Canadian cattle inventories were up marginally (0.2 per cent) at 12.1 million head. Total inventories in 2015 and 2016 were revised higher by 5,000 head (0.04 per cent) and 75,000 head (0.6 per cent), respectively. 2017 is the second year of larger total cattle inventories following a 0.9 per cent increase in 2016. However, the increases were both minor, leaving industry in the consolidation phase.
Read Also
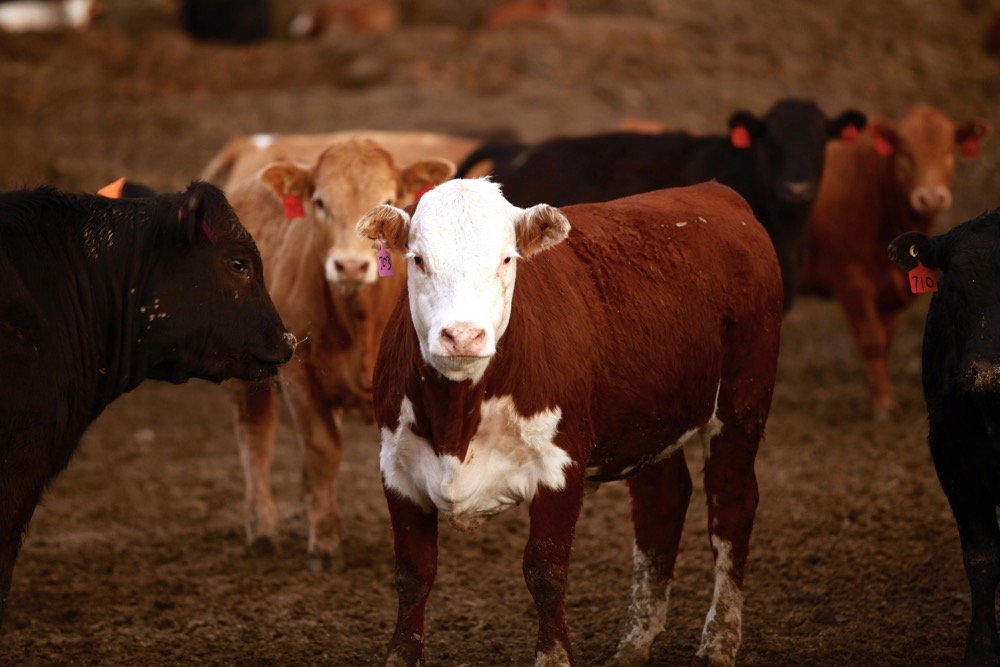
Pen riders still better than tech at detecting respiratory disease in feedlot cattle, says researcher
Recent research found that pen riders are better than tech at flagging signs of BRD in feedlot cattle
The beef cow herd was up 0.2 per cent to 3.8 million head on January 1, 2017, as a 3.8 per cent or 20,200 head increase in breeding heifer inventories last year could not offset cow marketings, which were up 3.6 per cent or 20,800 head. Beef cows consolidated in the East and expanded in a couple of provinces in the West with the Atlantic provinces 4.9 per cent, Ontario -3 per cent, Quebec -0.3 per cent, Manitoba -0.3 per cent, Alberta 0.8 per cent, British Columbia +2.1 per cent and Saskatchewan +2.4 per cent.
With sharply lower cattle prices dampening cow-calf margins in 2016, the signal for expansion has waned. Breeding heifer numbers were down 1.8 per cent to 536,600 head, which is in line with the 10-year average of 538,600 head. Provincially, heifer retention was down in Ontario (-4.6 per cent), Manitoba (-4.1 per cent), Alberta (-2.2 per cent) and Saskatchewan (-1.8 per cent); but up in Quebec (+10 per cent), the Atlantic provinces (+3.2 per cent) and British Columbia (+1.8 per cent).

Combining beef cow and breeding heifers, the total breeding female numbers were steady at 4.4 million head. The steady breeding female inventory suggests limited growth in the new calf crop. Feeder exports will remain the critical factor for domestic cattle supplies.
While steer (>1 year old) and slaughter heifer inventories were up 1.1 per cent (or 22,900 head) to 2.1 million head, the number of cattle on feeding operations on January 1 was fully steady with last year at 1.4 million head. The number of calves (<1 year old) was also up slightly by 0.4 per cent to four million head, which is the largest January calf inventory since 2013. Consequently, feeder and calf supply outside of feedlots was up 0.8 per cent (or 32,000 head) to 4.1 million head.
U.S. herd expansion continues
USDA reported U.S. total cattle and calf inventories on January 1 were up 1.8 per cent at 93.5 million head. As anticipated, the U.S. beef industry continued to expand the herd throughout 2016. Beef cows were up 3.5 per cent at 31.2 million head. Beef cow inventories are now 2.1 million head larger than the 2014 low, at the highest level since 2010. This is the fastest three-year growth rate in 40 years in terms of a percentage increase in cow numbers. This was the result of the major run up in prices, as well as the major shift in weather patterns from extreme drought, to much more optimal moisture conditions. Given current weather conditions, market conditions, and heifer retention, there could certainly be more cows in 2018. That would mark the fourth year of this expansion phase. In 1982, it was the fourth and last year of expansion, while in the 1990s, cow numbers grew from 1991 to 1996.

Not only did this latest report confirm herd expansion, it pointed to further growth. Despite U.S. fed cattle prices falling throughout 2016, heifers retained for breeding were up 1.2 per cent. Pre-report estimates were for heifer replacements to be down as expansion slowed. Breeding heifers are now at the highest level since 1995, after six consecutive years of growth. But it is the smallest year- over-year increase in these past six years with 2016 up four per cent, and 2015 up 9.6 per cent. Expansion is slowing as the number of heifers on feed and being slaughtered are increasing, but it is occurring at a slower rate than analysts projected. Beef cow slaughter has increased but, given the larger herd, the cull rate remains quite low.
Given the continued expansion, larger upcoming calf crops point to growing beef supplies through the remainder of this decade. Barring any major weather event, and continued large carcass weights, the U.S. will likely set new beef production records in this cycle.

Cycle indicators
The female-to-male disposal ratio (the number of cows and heifers exported live or slaughtered domestically for every bull or steer) was 0.92 in 2015 and 2016; this is below the long-term average of 1.02 but may simply reflect the larger heifer exports to the U.S. in 2013-15 that reduced the number of females available in Canada. Hence, this is not an indication of expansion. This is confirmed by the heifer slaughter ratio (the number of heifers slaughtered for every 100 steers) at 61 in both 2015 and 2016; below the historic average of 70. As exports of feeder heifers for breeding dipped in 2015 before rebounding in 2016, heifer slaughter may increase in 2017. This is already occurring to some extent with heifer slaughter up eight per cent in the first quarter, while steer slaughter is up three per cent.
The beef cow culling rate in 2016 was 11.7 per cent right in line with the historic average. In the first quarter of 2017 cow slaughter has been up 11 per cent (11,815 head) while exports are down 36 per cent (17,000 head). Overall, cow marketings are down slightly but not enough to say anything definitive about.
Alberta D1,2 cow prices have been tracking with the five-year average, rallying from a low of $93/cwt in February to $103/cwt by the end of March. Alberta cows have traded at a $11-22/cwt premium to the U.S. market in the first quarter and had a $13-20/cwt premium over the Ontario market. Ontario D1,2 cow prices continue to lag behind the five-year average, but the gap has narrowed as prices rallied from a low of $75/cwt in January to $88/cwt in mid-March.
Beef production
Canadian beef production (domestic slaughter and live slaughter exports) was up 9.6 per cent in 2016 at 2.99 billion pounds (1.35 million tonnes). Domestic production was up eight per cent and live slaughter exports up 20 per cent. Larger production came from a 6.9 per cent increase in marketings (with reduced feeder cattle exports in 2015-16) being amplified by record large carcass weights. Steer carcass weights were up 24 lbs. to average 919 lbs. for the year.
In the first quarter of 2017, domestic beef production is up three per cent with fed beef production up two per cent as smaller carcass weights reduce tonnage despite fed slaughter being up five per cent. Non-fed beef production (coming from cows and bulls) is up seven per cent, despite slaughter being up 13 per cent. Carcass weights from all cattle were down 32 lbs. from last year in the first quarter.

U.S. beef production is up 4.9 per cent year-to-date but strong export demand (up 23 per cent from last year) has been supportive to prices.
Cutout values
The AAA cutout has rallied 11 per cent from the January low to $274/cwt by the beginning of March. This is only six per cent below last year’s price the same week. The AA cutout is up 10 per cent from the January low and only four per cent below last year’s.
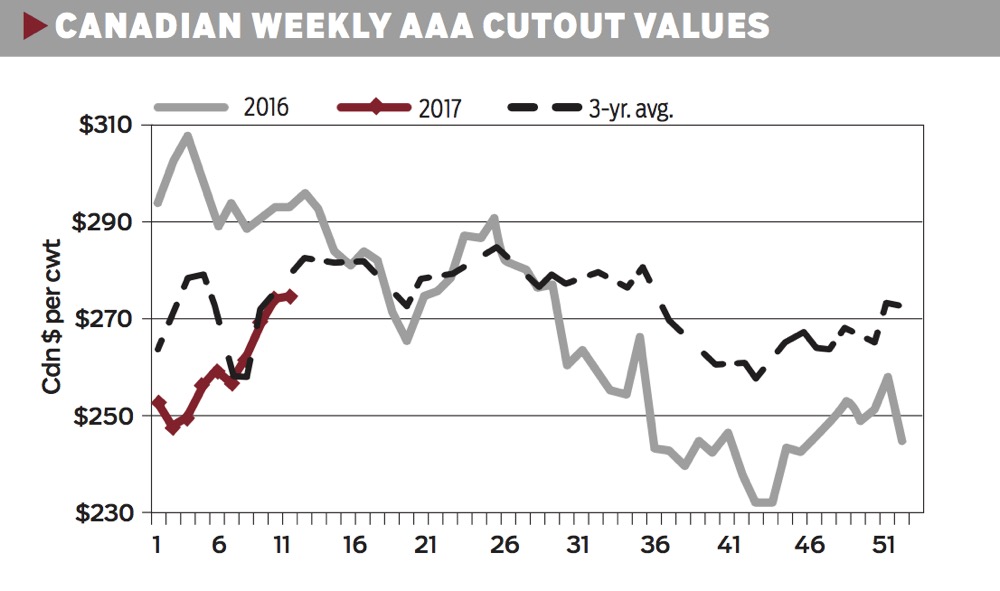
The cutout has been supported by stronger 50 per cent trim prices, which have been soft in January and February during the last three years but stayed strong in 2017. In fact, 50 per cent trim prices rallied by the end of January to be 57 per cent stronger than last year and 18 per cent stronger than the three-year average in February. This has been supportive to some end meats and thin cuts — particularly the chuck and short plate. In contrast, lean 85 per cent trim is running five per cent below last year and 10 per cent below the three-year average.
Throughout February the AAA and AA cutouts ran at a premium to the U.S. Choice and Select. The last time the Canadian market was at a premium to the U.S. in February was 2013.

Fed cattle
Alberta fed cattle prices rallied 28 per cent from the October low of $131/cwt to $168/cwt in March, to be back at year-ago levels. Feedlots regained leverage with packers despite protein supplies increasing in North America as packers were caught short in the first quarter with better than anticipated demand and domestic production barely steady as carcass weights dropped.
The live steer as a percentage of the AAA cutout rebounded from a low of 54 per cent in September 2016 to 63 per cent in January 2017 before settling around 60 per cent in February. This is firmly back in the range established in the second half of 2010 and would imply feedlots continue to have some leverage. At 62 per cent in March, feedlots are in a better leverage position than last year when the fed steer price was 58 per cent of the AAA cutout.
The rebound has been stronger in Alberta compared to Eastern Canada. Consequently, the Alberta-to-Ontario price spread widened to a record larger $20/cwt in December 2016. While it has narrowed in the first quarter of 2017, it remains around $13/cwt in March. Eastern Canadian slaughter has increased from around 10,000 head per week in early January to 14,000 head the week of March 11, 2017. Since early February, weekly slaughter has averaged 1,650 head larger than last year. Of the 17,250 head/week of capacity in the East, there is 4,000 head dedicated to veal. Weekly veal slaughter has averaged 3,850 head/week in 2017 at around 96 per cent utilization. This makes capacity for fed and non-fed cattle around 13,250 head/week and the weekly average for March was pushing that capacity in an effort to get current. Eastern slaughter is up 11 per cent year-to-date.

The Alberta market has also performed stronger than historically against the U.S. market as well. The Alberta- to-Nebraska cash-to-cash basis was positive in January and February before weakening in March. The March 2017 basis at -$5.50/cwt is still very strong compared to -$11.80/cwt in 2016 or the five-year average of -$15.50/cwt.

Feeder cattle
Despite the strong fed cattle cash prices, feeder cattle prices continue to lag $8/cwt below the five-year average on 800-900-lb. steers and $15/cwt below on 500-600-lb. steers. Feedlot margins just got into the black in December with the cash prices. For cattle that were contracted at lower prices, they would have still been in the red. Feeders placed in March are still projecting a loss when hedged.

The feeder basis has been exceptionally strong in the first quarter, and was essentially at par in January and February before weakening to -$7.42/cwt in March. This is the strongest feeder basis since 1987 and stands in stark contrast to the five-year average of -$15-21/ cwt as the first quarter is typically the weakest quarter encouraging feeder cattle to go south. When comparing historically we should keep in mind that in the fall of 2016 the CME feeder futures index weight was increased by 50 lbs. and, therefore, we can expect the feeder basis being about $3/cwt stronger.
Feeder cattle exports are down 37 per cent year-to- date after being down 41 per cent in 2016 and 31 per cent in 2015.
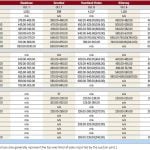
Replacement ratios
The lower the replacement ratio, the fewer dollars the feedlot must pay to replace a fed animal with a feeder; conversely,
a higher ratio means the feedlot must pay more per pound
to replace those animals. Consequently, a higher ratio has negative implications on feedlot profitability as more dollars are spent placing new cattle. Replacement ratios peaked in the second half of 2015 and declined throughout 2016. In the first quarter of 2017, replacement ratios stabilized from fourth quarter 2016 but remain below year-ago levels to be the lowest since the second quarter of 2013.
Steers 500-600 lbs. were down the most at 1.12 and 1.16 in the East and West, respectively, compared to Q1 2016. Heifers 600-700 lbs. were down the least at 1.15 and 1.03 in the East and West, respectively. Overall steers 700-800 lbs. have the highest replacement ratios.