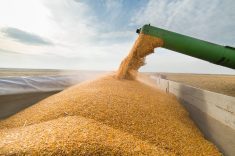
Corn on the nearby weekly futures contract has lost 50 per cent of its value since rallying to a record high of $8.43 3/4 in August 2012. Cash prices are closer to $3.50 per bushel — a price not seen since July 2010.
Pressuring the market is the U.S. Department of Agriculture’s estimate of a record 13.84 billion-bushel U.S. corn crop and a 1.86 billion-bushel carryout for the 2013-14 crop year. This certainly alleviates the tight ending stocks situation experienced during the 2012-13 crop year when supplies were drawn down to 661 million bushels.
Read Also

U.S. grains: Corn sets contract lows on expectations for big US crop
Chicago Board of Trade corn futures set contract lows and soybean futures sagged on Friday on expectations that beneficial weather for U.S. crops will lead to bumper harvests, analysts said.
The last time the U.S. had a corn carryout similar to this year’s forecast was in 2009-10, when the ending stocks were 1.7 billion bushels. During that period, the nearby futures contract traded between $4.20 and $3.20 per bushel (all figures US$).
Some are surprised prices have declined to current levels, especially farmers who may be growing corn for the first time. Last year’s record-high prices resulted in corn being one of the crops having the highest return. This inspired first-time growers to try their hand at producing a crop of corn this year.
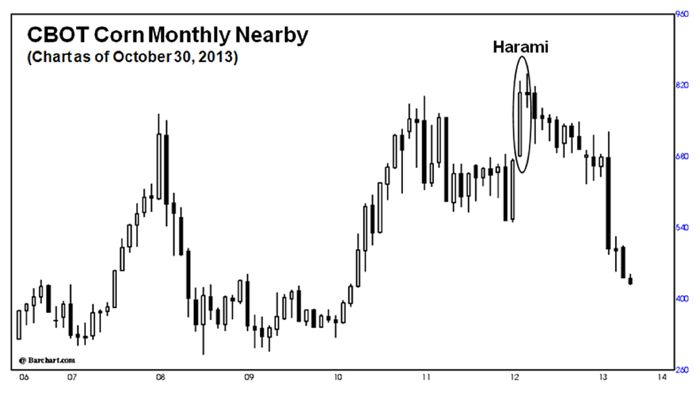
Others may not have been surprised by the downturn given the reversal pattern that materialized on the monthly nearby futures candlestick chart, at the market’s high, 15 months ago.
Introduction to candlestick charting
Candlestick charting provides an insight into market activity that is not readily apparent with the conventional bar type charts. When you see a black candle you know the sentiment is bearish. When the candle is white, it is bullish.
The Japanese are regarded as the true pioneers of market technical analysis. They began trading forward rice contracts (futures) in 1654 and by the year 1750 had developed quite a refined system for analyzing the markets.
These same techniques have evolved over two and a half centuries into an amazingly powerful modern-day charting method called candlestick. The Japanese method of charting is called candlestick because the individual lines resemble candles.
Basic construction of a candlestick line
The daily line shows the open, high, low and close. The thick part or candle is called the real body. It highlights the range between the open and close. If the close is above the open, then the body will be white. When the real body is black this simply means the close was below the open.
The lines above and below the real body represent the high and low ranges for the period and are called shadows.
A long black body illustrates a bearish period in the market with an opening near the day’s high and close near the day’s low.
A long white body is the opposite of a long black body and shows technical strength with an opening near the low and a close near the high in a wide range period.
Spinning tops are lines with small real bodies. The small body represents a tight range between the open and close. Spinning tops are regarded as neutral in most situations. However, when combined with other patterns they can be very significant, such was the case when the harami developed at the top of the corn market.
Harami lines
The harami line is similar to an inside day used in bar chart analysis. However, this interpretation suggests a waning in momentum and a possible trend change. As illustrated in the accompanying chart, the short black body of the harami must be contained by a long real white body preceding it.
A reversal pattern of any kind is more significant when it not only occurs at a market high, but when it appears on a long term chart such as a monthly or weekly chart.
Having a basic understanding of candlestick charting is an invaluable tool for being alerted to the major turns in the market.
Send your questions or comments about this article and chart.
— David Drozd is president and senior market analyst for Winnipeg-based Ag-Chieve Corp. The opinions expressed are those of the writer and are solely intended to assist readers with a better understanding of technical analysis. Visit Ag-Chieve online for information about grain marketing advisory services, or call us toll-free at 1-888-274-3138 for a free consultation.