The Canadian cattle herd continued to be steady, but reduced feeder exports in 2017 was supportive to domestic beef production. Strong demand, especially from the global market, kept beef and cattle prices firm despite increased production. While the cattle market continued to be strong at the beginning of 2018, larger on-feed inventories and increasing feed prices could add some caution to the market going forward.
Cattle inventories
Canadian beef cow inventories stable
January 1, 2018 total cattle inventories were up by 0.9 per cent at 11.6 million head but remained 22.1 per cent below the peak levels reported in January 2005. Since 2011, and the start of the consolidation phase, inventories are down 4.4 per cent.
Read Also
The Canadian Cattle Association’s international advocacy efforts
Global ag policies affect Canadian food policy, so the Canadian Cattle Association participates in international and domestic forums

Beef cow numbers were up 0.8 per cent to 3.7 million head. This is the second consecutive year of larger beef cow inventories, but the increases over the two years were minor as inventories have only increased by 34,500 head, just under one per cent. Prior to the last two years, Canadian cow numbers had declined for 11 consecutive years. Beef cow numbers peaked at 5.25 million head in 2005, fell 30 per cent to a low of 3.68 million in 2016, and are currently at a similar level to where they were in 1991-92. Since 2011, and the start of the consolidation phase beef cow inventories are down 8.3 per cent.
Beef cow numbers were up in all provinces except Alberta. Alberta cow numbers were down 1.3 per cent, or 20,000 head. This was likely related to dry conditions in the south, and could have also been impacted due to the culling as a result of the TB case. The biggest growth was seen in Manitoba and the Atlantic provinces with cow numbers up 5.6 per cent and 5.8 per cent, respectively. Cow numbers were up 2.1 per cent in B.C., 1.6 per cent in Saskatchewan and 0.6 per cent in Ontario.

The number of beef heifers held for breeding was down 0.3 per cent to 561,600 head. Breeding heifers were down 0.7 per cent in Western Canada but were up 2.7 per cent in Eastern Canada. Dry conditions in the west may have had an impact on heifer retention in the region.
The number of steers rose 2.1 per cent to 1.2 million head and feeder heifer inventories were up 1.1 per cent to 740,000 head. The larger feeder cattle inventories were expected given a stable cow herd, reduced feeder cattle exports, and an increase in feeder cattle imports in 2017. Calf numbers were up by 0.1 per cent to 3.8 million head. Although feeder and calf supplies increased, this was offset by an increase in cattle-on-feed numbers, and overall, the supply of beef feeder cattle and calves outside of feedlots is down 0.1 per cent from last year, and remains eight per cent smaller than the 10-year average.
U.S. herd expansion slows
U.S. total cattle inventories on January 1, 2018, were reported at 94.4 million head, 0.74 per cent higher than a year ago. Compared to the two to three per cent increase in the last two years, the smaller growth this year shows that the rate of herd expansion in the U.S. has slowed and may be nearing its peak.
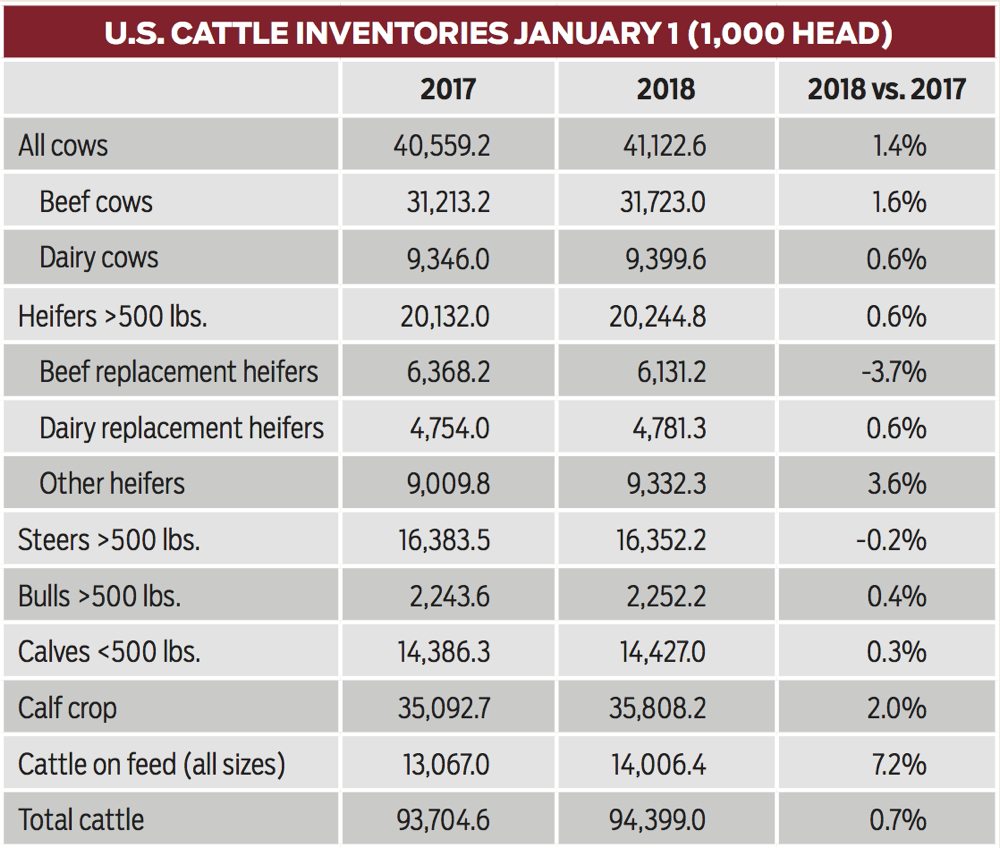
Beef cow inventories were up two per cent to 31.7 million head. These are the largest beef cow numbers since 2008. Beef replacement heifers, on the other hand, were down four per cent to 6.1 million head as more heifers went into the feeding sector. This is the first year-over-year decline since 2011, but the beef replacement heifer number remained at the third-highest level since 1996. Total breeding female inventories were up one per cent to 37.9 million head, following a three per cent increase a year ago.
The 2017 calf crop was up two per cent to 35.8 million head, which was revised down by 1.4 per cent from the July 1, 2017 report. The numbers of calves under 500 pounds and feeder steers were mostly steady with year-ago numbers, while other heifers were up 3.6 per cent. Total calf and feeder cattle numbers were up by about one per cent at 40.1 million head.

As feedlots have been aggressively marketing and placing cattle through 2017, total cattle-on-feed inventories were up a significant 7.2 per cent to 14 million head. This is the largest January 1 on-feed inventory since 2012. Given the big increase in cattle-on-feed numbers and the relatively steady calf and feeder numbers, feeder supply outside of feedlots is two per cent below year-ago levels at 26.1 million head. This is a positive aspect of the marketplace starting 2018. On the other hand, another market test will come as the larger slaughters number hit the market this summer.
Domestic beef production up
While cattle inventories remained steady, Canadian beef production was supported by reduced feeder exports in 2017 with annual export volumes down 34 per cent from a year ago.
Canadian beef production (domestic slaughter and live slaughter exports) was up 1.6 per cent in 2017 at 2.97 billion pounds (1.35 million tonnes), with domestic production up four per cent and live slaughter exports down 11 per cent.

Canadian cattle slaughter (federally and provincially inspected) at 3.01 million head was up seven per cent from 2016 and up eight per cent from the five-year average. This is the largest annual slaughter since 2011. Larger slaughter was offset by smaller carcass weights throughout the year with steers down 25 lbs., heifers down 17 lbs., cows down 15 lbs. and bulls up 11 lbs. Total cattle weights were down 24 lbs. for the year. Consequently, domestic beef production was only up four per cent.
In the first quarter of 2018, domestic beef production is up seven per cent with fed beef production up six per cent and non-fed up nine per cent. Carcass weights from all cattle were in line with year-ago levels.
Prices holding firm
Cut-out values
The AAA cut-out averaged $267/cwt in 2017, down only $1/cwt or 0.42 per cent from 2016. The AA cut-out averaged $253/cwt, down $4/cwt or two per cent. The 2017 cut-out composite value (weighted average of AAA and AA cut-outs) was down one per cent at $261/cwt. This is the third-highest annual average since reporting started in 2004, with the two higher years being 2015 and 2016.

Boxed beef prices were flat in the first two months of 2018 as snow continues to fall and Easter is later this year, but a stronger rally started in March. The AAA cut-out was slightly down from $257/cwt in January to $256/cwt in February, before rebounding to $268/cwt in March; while the AA cut-out climbed from $250/cwt to $262/cwt throughout the first quarter. As of mid-March, both AAA and AA cut-outs were steady with year-ago levels.
Fed cattle
From the low in September 2017 at $133/cwt, Alberta fed cattle prices rallied 23 per cent to $163/cwt in March 2018. Prices have been quite flat in the first quarter, ranging between $160/cwt and $167/cwt. Compared to last year, prices were three to four per cent higher in the first two months before dropping to three per cent lower in March.
Ontario fed cattle prices followed a similar pattern but did not keep pace with Alberta. Monthly prices rallied 18 per cent from the September low of $125/cwt to $148/cwt in March, but remained five per cent lower than year-ago levels.
Ontario fed prices have been at a discount to Alberta since August 2017. The Alberta-Ontario price spread widened from $1/cwt in August to $23/cwt in January before narrowing to $15/cwt in March. The discount on Ontario fed cattle reflected a combination of the strong Alberta market and larger carcass weights in the east. While Ontario consistently feeds their fed cattle to higher weights than Alberta, steer carcass weights in Eastern Canada averaged 94 lbs. heavier than Western Canada in 2017, compared to a five-year average of 42 lbs.

The Alberta market has also performed stronger than historically against the U.S. market. The Alberta Nebraska cash-to-cash basis started 2018 at record strong levels, averaging +$10.95/cwt in January and +$3.06/cwt in February. This compares to year-ago levels at +$0.22/cwt to +$1.79/cwt, and the five-year average at -$9.68/cwt to -$10.82/cwt. The stronger-than-average basis levels have been driven by regional supply and demand dynamics, with strong demand from western Canadian packers and larger cattle supplies in the U.S. Fed cattle exports are down 18 per cent year to date.
Last year, the cattle market saw a strong spring rally during February to May when the market outperformed expectations with lighter carcass weights and strong exports. So far in 2018, carcass weights have been in line with year-ago levels. Steer carcass weights are averaging five lbs. lighter than a year ago at 910 lbs., while heifer carcass weights are averaging seven lbs. heavier at 834 lbs.

Alberta and Saskatchewan cattle-on-feed inventories on March 1 totaled 896,673 head, up three per cent from last year. This is the tenth consecutive month where on-feed inventories have been above year-ago levels. However, placements have been running five to 20 per cent below year-ago levels since December, while marketings were up four to 16 per cent during the same period. This has brought the year-over-year increase in on-feed inventories down from 12 per cent in December to three per cent in March, easing some pressure on the supply side.
Feeder cattle
Alberta 800- to 900-lb. steer prices started the year at $182/cwt in the first month, but have since been under pressure, losing $11/cwt to $171/cwt in March. The monthly average in March was down 15 per cent or $30/cwt from the November high, but remained three per cent above year-ago levels.
The feeder basis weakened from +$6/cwt in December to -$8/cwt in March, but remains stronger than the five-year average (-$20/cwt). Feeder cattle exports are up 48 per cent year-to-date. Larger feeder exports might be partly driven by higher feed costs in Western Canada. Lethbridge barley prices have surged 49 per cent from $164/tonne in March 2017 to $245/cwt in March 2018 with tighter supplies. In comparison, corn prices have been relatively steady in Ontario and Nebraska until the recent uptick associated with weather concerns in the U.S. and Argentina. The rising barley price has put Alberta at a feeding disadvantage to Ontario and Nebraska. With Ontario and Omaha corn prices being 23 per cent and 20 per cent lower than Lethbridge barley, respectively, there might be more competition for western Canadian calves and feeders coming from Eastern Canada and stateside.

Cow-calf profitability
With strong calf prices in 2017, Alberta cow-calf returns are projected to be up nearly two times from $119/cow in 2016 to $203/cow. This is the seventh consecutive year of positive cow-calf returns and is significantly higher than the long-term (1990-2016) average of $81/cow.
During the expansion phase in 2000-02, cow-calf returns were estimated at $157-224/cow. Compared to this, the positive returns in the past few years between $107-752/cwt should be a supporting factor for herd expansion. While the record-high profits in 2014 and 2015 provided an opportunity for producers to rebuild equity and invest in major infrastructures, lower prices in 2016 and dry conditions in part of Western Canada in 2017 may have seen producers put expansion on hold.

Looking forward to 2018, weather will continue to be a key factor in herd expansion. Dry conditions in 2017 have pushed a large amount of calves into feedlots as calf placements in the fourth quarter were up 53 per cent from a year ago. Alberta hay prices also surged from $118/ton in September 2017 to $141/ton in February 2018 to be 29 per cent higher than a year ago. Uncertainties around U.S. pork exports to China may also cause some caution, as large pork supplies in the North American market could affect Canadian beef and cattle prices.
Solid international demand
A key driver for beef and cattle prices last year was solid international demand. In 2017, total beef exports were up 5.7 per cent in volume and 6.1 per cent in value at 379,950 tonnes (product weight) valued at $2.41 billion. Annual volumes reached the highest level since 2010, while export values reached a new record high. In January 2018, beef exports continued to be strong with volumes up eight per cent and values up 11 per cent from last year.
Despite uncertainty around NAFTA renegotiations, expanded market access to China, the signing of the Comprehensive and Progressive Agreement for Trans-Pacific Partnership (CPTPP), and the ending of Japan’s tariff hike on frozen beef are expected to positively affect Canadian beef exports.
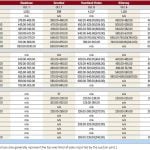
Replacement ratios
The lower the replacement ratio, the fewer dollars the feedlot must pay to replace a fed animal with a feeder; conversely, a higher ratio means the feedlot must pay more per pound to replace those animals. Consequently, a higher ratio has negative implications on feedlot profitability as more dollars are spent placing new cattle.
Replacement ratios peaked in October 2017 and trended lower since then with steady to lower feeder prices and stronger fed prices. From the Q4 2017 to Q1 2018, the replacement ratios were down eight to 14 per cent in the east and 11 to 18 per cent in the west.
Despite the downtrend, replacement ratios for all categories remained higher than year-ago levels. In the east, heifer calves were up 15 per cent, steer calves were up 25 per cent, yearling heifers were up 15 per cent, and yearling steers and short-keep steers were up 13 per cent compared to Q1 2017. In the west, heifer calves were up 12 per cent, steer calves were up 11 per cent, yearling heifers were up nine per cent, and yearling steers and shortkeep steers were up seven per cent.